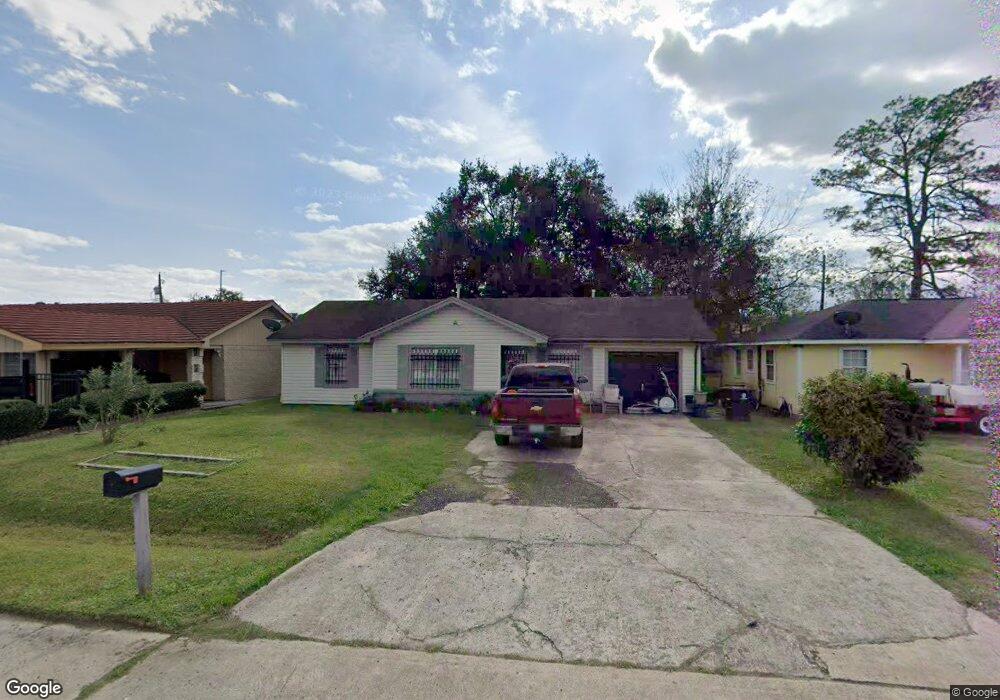
6950 Peyton St Houston, TX 77028
Trinity-Houston Gardens NeighborhoodEstimated Value: $141,000 - $163,000
3
Beds
1
Bath
982
Sq Ft
$152/Sq Ft
Est. Value
About This Home
This home is located at 6950 Peyton St, Houston, TX 77028 and is currently estimated at $149,506, approximately $152 per square foot. 6950 Peyton St is a home located in Harris County with nearby schools including McGowen Elementary School, Key Middle, and Kashmere High School.
Ownership History
Date
Name
Owned For
Owner Type
Purchase Details
Closed on
Nov 28, 2016
Sold by
Cp Originations Ltd
Bought by
Lopez Alejandro Vances
Current Estimated Value
Home Financials for this Owner
Home Financials are based on the most recent Mortgage that was taken out on this home.
Original Mortgage
$95,700
Outstanding Balance
$76,333
Interest Rate
3.47%
Mortgage Type
New Conventional
Estimated Equity
$73,173
Purchase Details
Closed on
Aug 26, 2016
Sold by
Lathon Prentis and Lathon Martha
Bought by
Cp Originations Ltd
Home Financials for this Owner
Home Financials are based on the most recent Mortgage that was taken out on this home.
Original Mortgage
$59,440
Interest Rate
3.42%
Mortgage Type
Commercial
Purchase Details
Closed on
Aug 28, 1998
Sold by
Lathon Prentis
Bought by
Walker Claude Eric
Purchase Details
Closed on
May 7, 1998
Sold by
Wilborn Sean Corbit
Bought by
Lathon Prentis and Lathon Martha
Create a Home Valuation Report for This Property
The Home Valuation Report is an in-depth analysis detailing your home's value as well as a comparison with similar homes in the area
Home Values in the Area
Average Home Value in this Area
Purchase History
| Date | Buyer | Sale Price | Title Company |
|---|---|---|---|
| Lopez Alejandro Vances | -- | South Land Title Llc | |
| Lopez Alejandro Vences | -- | South Land Title Llc | |
| Cp Originations Ltd | -- | North Star Title Co | |
| Walker Claude Eric | -- | -- | |
| Lathon Prentis | -- | -- |
Source: Public Records
Mortgage History
| Date | Status | Borrower | Loan Amount |
|---|---|---|---|
| Open | Lopez Alejandro Vences | $95,700 | |
| Closed | Lopez Alejandro Vances | $95,700 | |
| Previous Owner | Cp Originations Ltd | $59,440 |
Source: Public Records
Tax History
| Year | Tax Paid | Tax Assessment Tax Assessment Total Assessment is a certain percentage of the fair market value that is determined by local assessors to be the total taxable value of land and additions on the property. | Land | Improvement |
|---|---|---|---|---|
| 2025 | $865 | $111,833 | $63,900 | $47,933 |
| 2024 | $865 | $108,397 | $51,120 | $57,277 |
| 2023 | $865 | $81,259 | $25,560 | $55,699 |
| 2022 | $1,603 | $72,780 | $17,040 | $55,740 |
| 2021 | $1,696 | $72,780 | $17,040 | $55,740 |
| 2020 | $1,762 | $72,780 | $17,040 | $55,740 |
| 2019 | $1,735 | $68,574 | $14,058 | $54,516 |
| 2018 | $1,564 | $61,790 | $14,058 | $47,732 |
| 2017 | $1,562 | $61,790 | $14,058 | $47,732 |
| 2016 | $1,250 | $49,425 | $12,780 | $36,645 |
| 2015 | $924 | $49,425 | $12,780 | $36,645 |
| 2014 | $924 | $35,944 | $12,780 | $23,164 |
Source: Public Records
Map
Nearby Homes
- 6942 Peyton St
- 6929 Peyton St
- 7002 Jay St
- 6701 Mariosa St
- 6622 Hoffman St
- 5414 Bennington St
- 5402 Bennington St
- 6101 Shotwell St
- 6101 & 6103 Shotwell
- 6103 Shotwell St
- 0 Lynnfield St
- 00 Lynnfield St
- 6309 Sandra St
- 6305 Sandra St
- 5222 Bennington St
- 0 Sandra Unit 10021624
- 7222 Philibert Ln Unit A/B
- 7314 Philibert Ln
- 7306 Saint Louis St
- 7204 Homestead Rd
Your Personal Tour Guide
Ask me questions while you tour the home.