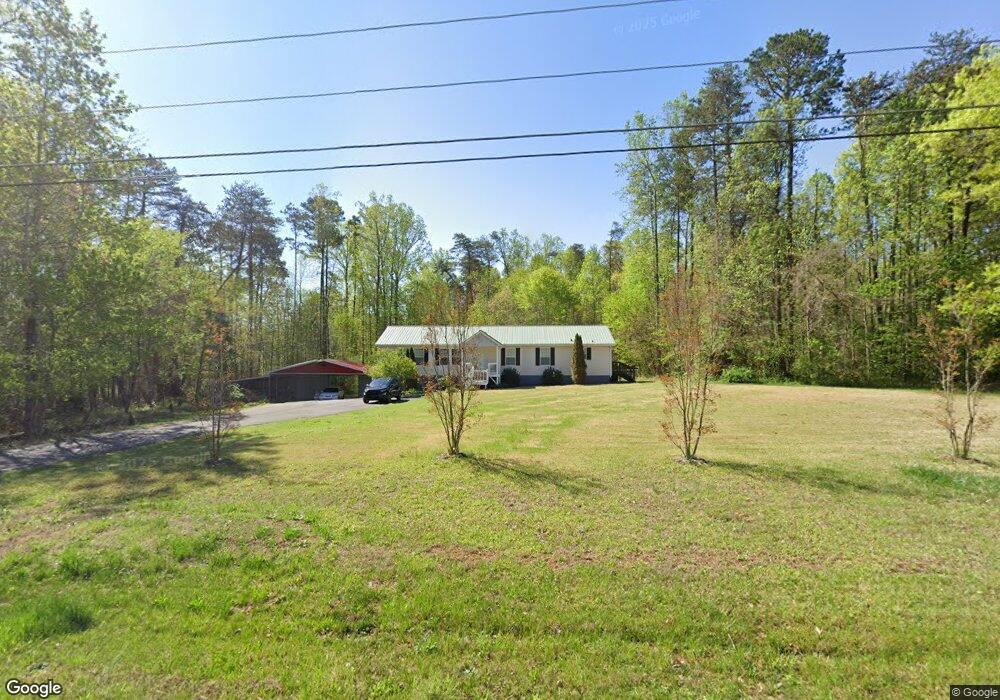
6950 Robinhood Rd Pfafftown, NC 27040
Estimated Value: $358,000 - $380,000
3
Beds
2
Baths
1,782
Sq Ft
$206/Sq Ft
Est. Value
About This Home
This home is located at 6950 Robinhood Rd, Pfafftown, NC 27040 and is currently estimated at $367,441, approximately $206 per square foot. 6950 Robinhood Rd is a home located in Forsyth County with nearby schools including Vienna Elementary School, Thomas Jefferson Middle School, and Ronald W. Reagan High School.
Ownership History
Date
Name
Owned For
Owner Type
Purchase Details
Closed on
Nov 19, 2024
Sold by
Hunter Heather B
Bought by
Steenburg Mann Nola
Current Estimated Value
Purchase Details
Closed on
Jul 24, 2024
Sold by
Hunter Brandon K and Hunter Heather B
Bought by
Hunter Heather B
Purchase Details
Closed on
Jun 7, 2010
Sold by
Factory Housing Of Boone Inc
Bought by
Hunter Brandon K and Hunter Heather B
Home Financials for this Owner
Home Financials are based on the most recent Mortgage that was taken out on this home.
Original Mortgage
$137,153
Interest Rate
5.5%
Mortgage Type
FHA
Purchase Details
Closed on
Dec 7, 2009
Sold by
Johnson Joseph
Bought by
Factory Housing Of Boone Inc
Create a Home Valuation Report for This Property
The Home Valuation Report is an in-depth analysis detailing your home's value as well as a comparison with similar homes in the area
Home Values in the Area
Average Home Value in this Area
Purchase History
| Date | Buyer | Sale Price | Title Company |
|---|---|---|---|
| Steenburg Mann Nola | $360,000 | None Listed On Document | |
| Steenburg Mann Nola | $360,000 | None Listed On Document | |
| Steenburg Mann Nola | $360,000 | None Listed On Document | |
| Hunter Heather B | -- | None Listed On Document | |
| Hunter Heather B | -- | None Listed On Document | |
| Hunter Brandon K | $139,000 | None Available | |
| Factory Housing Of Boone Inc | $125,000 | None Available |
Source: Public Records
Mortgage History
| Date | Status | Borrower | Loan Amount |
|---|---|---|---|
| Previous Owner | Hunter Brandon K | $137,153 |
Source: Public Records
Tax History Compared to Growth
Tax History
| Year | Tax Paid | Tax Assessment Tax Assessment Total Assessment is a certain percentage of the fair market value that is determined by local assessors to be the total taxable value of land and additions on the property. | Land | Improvement |
|---|---|---|---|---|
| 2025 | $1,631 | $288,300 | $93,900 | $194,400 |
| 2024 | $1,565 | $165,800 | $60,500 | $105,300 |
| 2023 | $1,565 | $165,800 | $60,500 | $105,300 |
| 2022 | $1,565 | $165,800 | $60,500 | $105,300 |
| 2021 | $1,565 | $165,800 | $60,500 | $105,300 |
| 2020 | $1,450 | $143,200 | $45,700 | $97,500 |
| 2019 | $1,465 | $143,200 | $45,700 | $97,500 |
| 2018 | $1,402 | $143,200 | $45,700 | $97,500 |
| 2016 | $1,477 | $150,253 | $43,137 | $107,116 |
| 2015 | $1,477 | $150,253 | $43,137 | $107,116 |
| 2014 | $1,456 | $150,253 | $43,137 | $107,116 |
Source: Public Records
Map
Nearby Homes
- 3650 Beroth Cir
- 3714 Beroth Cir
- 0 Conrad Rd
- 101 Wellesley Place Ct
- 1040 Wellesley Place Dr
- 1264 Lewisville Vienna Rd
- 1267 Lewisville Vienna Rd
- 105 Honeyridge Ct
- 2176 Vienna Dozier Rd
- 6158 Olde Fields Way
- 1769 Lewisville Vienna Rd
- 2204 Pellam Forest Ct
- 7340 Franklin Rd
- 315 Wyntfield Dr
- 0 Lewisville Vienna Rd
- 6208 Deforest Ct
- 7805 Grapevine Rd
- 1245 Whispering Wind Dr
- 7190 Spring Hill Rd
- 901 Tierney Dr
- 6970 Robinhood Rd
- 3501 Robinwest Dr
- 6900 Robinhood Rd
- 3500 Manoa Rd
- 3511 Robinwest Dr
- 6898 Robinhood Rd
- 3500 Robinwest Dr
- 120 Shore Craft Dr
- 3510 Manoa Rd
- 3510 Robinwest Dr
- 3521 Robinwest Dr
- 3520 Robinwest Dr
- 1955 Conrad Sawmill Rd
- 3531 and 3541 Robinwest Dr
- 3520 Manoa Rd
- 7011 Robinhood Rd
- 121 Shore Craft Dr
- 7010 Robinhood Rd
- 3511 Manoa Rd
- 3541 Robinwest Dr