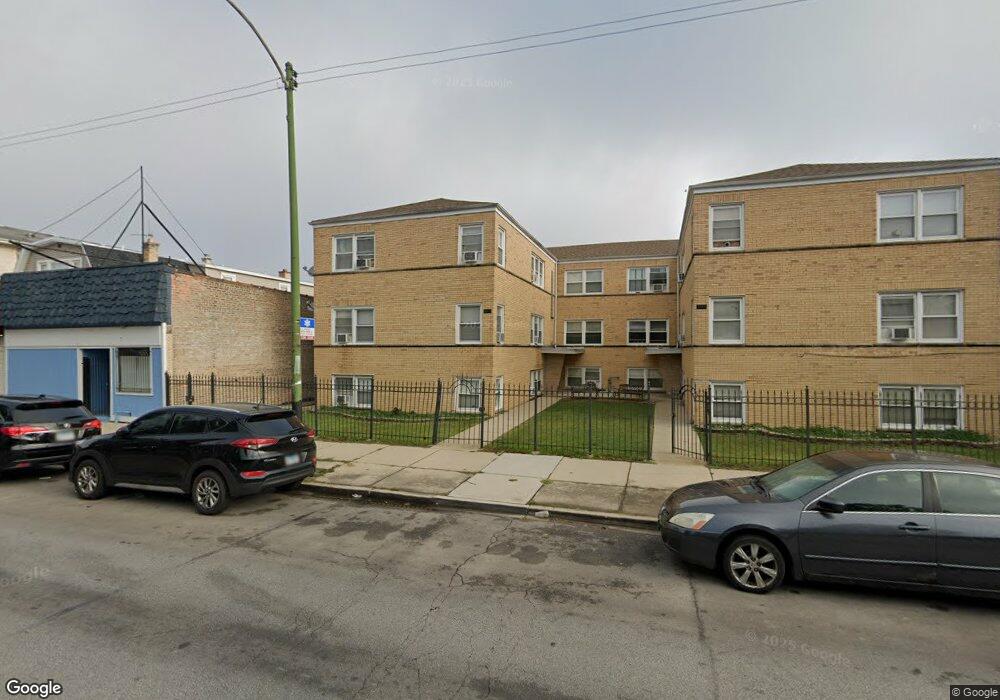
6952 W Diversey Ave Unit 3S Chicago, IL 60707
Montclare NeighborhoodEstimated Value: $179,000 - $207,000
2
Beds
1
Bath
11,175
Sq Ft
$17/Sq Ft
Est. Value
About This Home
This home is located at 6952 W Diversey Ave Unit 3S, Chicago, IL 60707 and is currently estimated at $188,209, approximately $16 per square foot. 6952 W Diversey Ave Unit 3S is a home located in Cook County with nearby schools including Locke J Elementary School, Steinmetz College Prep, and The Field School.
Ownership History
Date
Name
Owned For
Owner Type
Purchase Details
Closed on
Oct 10, 2006
Sold by
Morales Sender
Bought by
Morales Sender
Current Estimated Value
Purchase Details
Closed on
Aug 10, 2005
Sold by
Morales Sender
Bought by
Morales Sender and Morales Gabriela
Home Financials for this Owner
Home Financials are based on the most recent Mortgage that was taken out on this home.
Original Mortgage
$146,600
Interest Rate
5.69%
Mortgage Type
New Conventional
Purchase Details
Closed on
Jul 15, 2003
Sold by
Divine Developers Inc
Bought by
Morales Sender
Home Financials for this Owner
Home Financials are based on the most recent Mortgage that was taken out on this home.
Original Mortgage
$136,325
Interest Rate
6.23%
Mortgage Type
Unknown
Create a Home Valuation Report for This Property
The Home Valuation Report is an in-depth analysis detailing your home's value as well as a comparison with similar homes in the area
Home Values in the Area
Average Home Value in this Area
Purchase History
| Date | Buyer | Sale Price | Title Company |
|---|---|---|---|
| Morales Sender | -- | None Available | |
| Morales Sender | -- | Chicago Title Insurance Comp | |
| Morales Sender | $143,500 | Chicago Title Insurance Comp |
Source: Public Records
Mortgage History
| Date | Status | Borrower | Loan Amount |
|---|---|---|---|
| Closed | Morales Sender | $146,600 | |
| Previous Owner | Morales Sender | $136,325 |
Source: Public Records
Tax History Compared to Growth
Tax History
| Year | Tax Paid | Tax Assessment Tax Assessment Total Assessment is a certain percentage of the fair market value that is determined by local assessors to be the total taxable value of land and additions on the property. | Land | Improvement |
|---|---|---|---|---|
| 2024 | $1,622 | $14,470 | $2,577 | $11,893 |
| 2023 | $1,560 | $11,000 | $2,078 | $8,922 |
| 2022 | $1,560 | $11,000 | $2,078 | $8,922 |
| 2021 | $1,543 | $10,999 | $2,078 | $8,921 |
| 2020 | $1,366 | $9,230 | $1,038 | $8,192 |
| 2019 | $1,396 | $10,375 | $1,038 | $9,337 |
| 2018 | $1,372 | $10,375 | $1,038 | $9,337 |
| 2017 | $1,986 | $12,598 | $914 | $11,684 |
| 2016 | $2,024 | $12,598 | $914 | $11,684 |
| 2015 | $1,829 | $12,598 | $914 | $11,684 |
| 2014 | $1,919 | $12,903 | $872 | $12,031 |
| 2013 | $1,870 | $12,903 | $872 | $12,031 |
Source: Public Records
Map
Nearby Homes
- 6964 W Diversey Ave Unit 6
- 2846 N Sayre Ave
- 2714 N New England Ave
- 2913 N Nordica Ave
- 2930 N New England Ave
- 2619 N Sayre Ave
- 2659 N Mont Clare Ave
- 2712 N Oak Park Ave
- 2747 N Oak Park Ave
- 2919 N Harlem Ave Unit 411
- 2541 N Mont Clare Ave
- 2554 N Oak Park Ave
- 3011 N Oak Park Ave
- 6938 W Barry Ave
- 2930 N Harlem Ave Unit 5D
- 2734 N 72nd Ct
- 3105 N Nordica Ave
- 7201 W Wellington Ave Unit D1
- 2530 N Neva Ave
- 2546 N Harlem Ave Unit GC
- 6952 W Diversey Ave Unit 1S
- 6952 W Diversey Ave Unit 69523
- 6952 W Diversey Ave Unit 69521
- 6952 W Diversey Ave Unit 69523
- 6952 W Diversey Ave Unit 69521
- 6952 W Diversey Ave Unit 69522
- 6952 W Diversey Ave Unit 69522
- 6952 W Diversey Ave Unit 2S
- 6952 W Diversey Ave Unit 1N
- 6952 W Diversey Ave Unit 2N
- 6944 W Diversey Ave Unit 69441
- 6944 W Diversey Ave Unit 69441
- 6944 W Diversey Ave Unit 69442
- 6944 W Diversey Ave Unit 69443
- 6944 W Diversey Ave Unit 69443
- 6944 W Diversey Ave Unit 69442
- 6944 W Diversey Ave Unit 2S
- 6944 W Diversey Ave Unit 2N
- 6944 W Diversey Ave Unit 1S
- 6944 W Diversey Ave Unit 1N