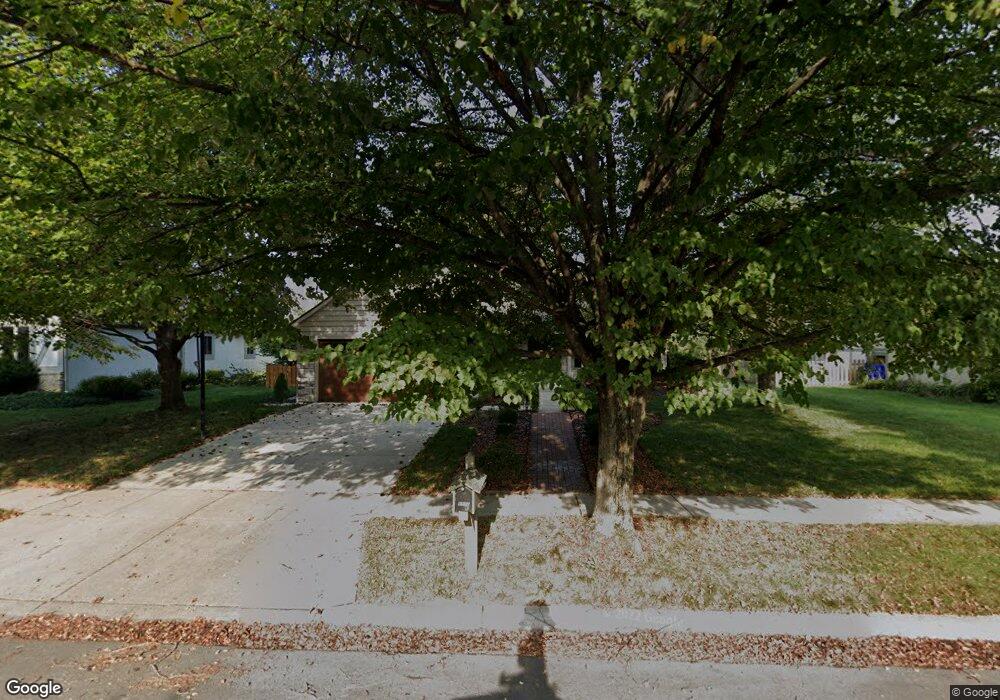
6953 Macgregor Ct Columbus, OH 43085
Olentangy Highlands NeighborhoodEstimated Value: $395,000 - $483,000
4
Beds
2
Baths
1,760
Sq Ft
$249/Sq Ft
Est. Value
About This Home
This home is located at 6953 Macgregor Ct, Columbus, OH 43085 and is currently estimated at $438,203, approximately $248 per square foot. 6953 Macgregor Ct is a home located in Franklin County with nearby schools including Evening Street Elementary School, Kilbourne Middle School, and Thomas Worthington High School.
Ownership History
Date
Name
Owned For
Owner Type
Purchase Details
Closed on
Feb 7, 2007
Sold by
Wells Fargo Bank Na
Bought by
Johnson Michael W and Hall Christine C
Current Estimated Value
Home Financials for this Owner
Home Financials are based on the most recent Mortgage that was taken out on this home.
Original Mortgage
$129,292
Outstanding Balance
$76,381
Interest Rate
6.28%
Mortgage Type
Purchase Money Mortgage
Estimated Equity
$361,822
Purchase Details
Closed on
Oct 5, 2006
Sold by
Loney Robert Craig and Case #05Cve01 296
Bought by
Wells Fargo Bank Na and Asset Backed Pass Through Certificates S
Purchase Details
Closed on
Jul 31, 1991
Bought by
Loney Robert C and Loney Donna R
Purchase Details
Closed on
May 21, 1991
Create a Home Valuation Report for This Property
The Home Valuation Report is an in-depth analysis detailing your home's value as well as a comparison with similar homes in the area
Home Values in the Area
Average Home Value in this Area
Purchase History
| Date | Buyer | Sale Price | Title Company |
|---|---|---|---|
| Johnson Michael W | $161,700 | Resourceti | |
| Wells Fargo Bank Na | $175,000 | Independent | |
| Loney Robert C | $134,900 | -- | |
| -- | $122,500 | -- |
Source: Public Records
Mortgage History
| Date | Status | Borrower | Loan Amount |
|---|---|---|---|
| Open | Johnson Michael W | $129,292 |
Source: Public Records
Tax History
| Year | Tax Paid | Tax Assessment Tax Assessment Total Assessment is a certain percentage of the fair market value that is determined by local assessors to be the total taxable value of land and additions on the property. | Land | Improvement |
|---|---|---|---|---|
| 2025 | $6,851 | $111,580 | $43,890 | $67,690 |
| 2024 | $6,851 | $111,580 | $43,890 | $67,690 |
| 2023 | $6,551 | $111,580 | $43,890 | $67,690 |
| 2022 | $6,185 | $83,590 | $25,520 | $58,070 |
| 2021 | $5,706 | $83,590 | $25,520 | $58,070 |
| 2020 | $5,496 | $83,590 | $25,520 | $58,070 |
| 2019 | $5,269 | $72,310 | $22,190 | $50,120 |
| 2018 | $4,769 | $72,310 | $22,190 | $50,120 |
| 2017 | $4,721 | $72,310 | $22,190 | $50,120 |
| 2016 | $4,434 | $62,450 | $20,550 | $41,900 |
| 2015 | $4,435 | $62,450 | $20,550 | $41,900 |
| 2014 | $4,433 | $62,450 | $20,550 | $41,900 |
| 2013 | $2,005 | $56,770 | $18,690 | $38,080 |
Source: Public Records
Map
Nearby Homes
- 1354 Lorine Place
- 941 Robbins Way
- 7044 Linworth Rd
- 7164 Durness Place
- 6829 Merwood St
- 1159 Tessier Dr
- 6577 Plesenton Dr S
- 1041 Bluffway Dr
- 6637 Merwin Rd
- 902-904 Bluffway Dr
- 1576 Fallhaven Dr
- 7155 Asheville Park Dr
- 7682 Traphill Ct
- 236 Weydon Rd
- 115 Saint Andre St Unit 9D
- 6924 Spruce Pine Dr
- 877 Northbridge Ln
- 203 Saint Pierre St Unit 4-C
- 6833 Spruce Pine Dr
- 742 Gatehouse Ln
- 6965 Macgregor Ct
- 1084 Macgregor Ave
- 6973 Macgregor Ct
- 6845 Macgregor Ct
- 6954 Macgregor Ct
- 6946 Macgregor Ct
- 6960 Macgregor Ct
- 7014 Perry Place
- 7002 Perry Place
- 1120 Macgregor Ave W
- 1120 MacGregor West Ave
- 1083 Macgregor Ave
- 1095 Macgregor Ave
- 6972 Macgregor Ct
- 6985 Macgregor Ct
- 1075 Macgregor Ave
- 7024 Perry Place
- 1065 Macgregor Ave
- 6931 Shetland St
- 6939 Shetland St
Your Personal Tour Guide
Ask me questions while you tour the home.