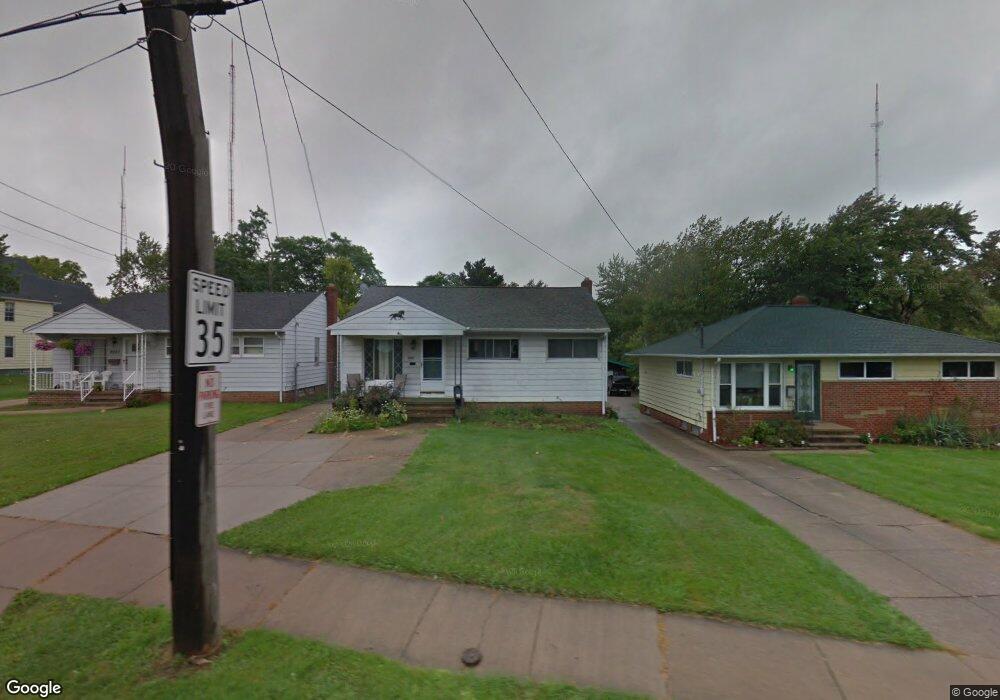
6956 State Rd Cleveland, OH 44134
Estimated Value: $156,000 - $244,000
3
Beds
1
Bath
1,020
Sq Ft
$198/Sq Ft
Est. Value
About This Home
This home is located at 6956 State Rd, Cleveland, OH 44134 and is currently estimated at $201,767, approximately $197 per square foot. 6956 State Rd is a home located in Cuyahoga County with nearby schools including Dentzler Elementary School, Normandy High School, and Hillside Middle School.
Ownership History
Date
Name
Owned For
Owner Type
Purchase Details
Closed on
Mar 12, 1998
Sold by
Ma Duc Hong and Ma King Yuk Chung
Bought by
Mcadams James L and Mcadams Colleen R
Current Estimated Value
Home Financials for this Owner
Home Financials are based on the most recent Mortgage that was taken out on this home.
Original Mortgage
$89,900
Outstanding Balance
$16,752
Interest Rate
7.23%
Mortgage Type
FHA
Estimated Equity
$185,015
Purchase Details
Closed on
Jul 13, 1992
Sold by
Polocy David P
Bought by
Ma Duc Hong
Purchase Details
Closed on
Sep 8, 1986
Sold by
Alfred J Palumbo
Bought by
Polocy David P
Purchase Details
Closed on
Feb 14, 1980
Sold by
Palumbo Alfred J
Bought by
Alfred J Palumbo
Purchase Details
Closed on
May 5, 1976
Sold by
Palumbo Alfred J and Palumbo Frances M
Bought by
Palumbo Alfred J
Purchase Details
Closed on
Jan 1, 1975
Bought by
Palumbo Alfred J and Palumbo Frances M
Create a Home Valuation Report for This Property
The Home Valuation Report is an in-depth analysis detailing your home's value as well as a comparison with similar homes in the area
Home Values in the Area
Average Home Value in this Area
Purchase History
| Date | Buyer | Sale Price | Title Company |
|---|---|---|---|
| Mcadams James L | $90,000 | -- | |
| Ma Duc Hong | $84,000 | -- | |
| Polocy David P | $59,000 | -- | |
| Alfred J Palumbo | -- | -- | |
| Palumbo Alfred J | -- | -- | |
| Palumbo Alfred J | -- | -- |
Source: Public Records
Mortgage History
| Date | Status | Borrower | Loan Amount |
|---|---|---|---|
| Open | Mcadams James L | $89,900 |
Source: Public Records
Tax History Compared to Growth
Tax History
| Year | Tax Paid | Tax Assessment Tax Assessment Total Assessment is a certain percentage of the fair market value that is determined by local assessors to be the total taxable value of land and additions on the property. | Land | Improvement |
|---|---|---|---|---|
| 2024 | $3,605 | $59,080 | $9,975 | $49,105 |
| 2023 | $2,879 | $40,010 | $8,020 | $31,990 |
| 2022 | $2,852 | $40,010 | $8,020 | $31,990 |
| 2021 | $2,932 | $40,010 | $8,020 | $31,990 |
| 2020 | $2,607 | $31,260 | $6,270 | $24,990 |
| 2019 | $2,494 | $89,300 | $17,900 | $71,400 |
| 2018 | $2,509 | $31,260 | $6,270 | $24,990 |
| 2017 | $2,415 | $28,040 | $4,310 | $23,730 |
| 2016 | $2,399 | $28,040 | $4,310 | $23,730 |
| 2015 | $2,245 | $28,040 | $4,310 | $23,730 |
| 2014 | $2,245 | $28,040 | $4,310 | $23,730 |
Source: Public Records
Map
Nearby Homes
- 3807 Klusner Ave
- 3711 Klusner Ave
- 7030 Lyle Ave
- 3610 Jeanne Dr
- 3430 Park Dr
- 3262 Marda Dr
- 3195 Marda Dr
- 3011 Klusner Ave
- 3200 Dentzler Rd
- 3018 Center Dr
- 0 Orchard Park Dr
- 5810 Ely Vista Dr
- 2838 Marda Dr
- 4601 W Ridgewood Dr
- 5208 Orchard Park Dr
- 7180 Marko Ln
- 4803 Sassafras Dr
- 5211 W Ridgewood Dr
- 4001 W Ridgewood Dr
- 6480 State Rd Unit F10
- 6962 State Rd
- 6950 State Rd
- 6946 State Rd
- 6960 State Rd
- 6978 State Rd
- 6988 State Rd
- 6951 State Rd
- 6947 State Rd
- 6997-7027 State Rd
- 6939 State Rd
- 6998 State Rd
- 3915 Klusner Ave
- 3780 Hetzel Dr
- 7015 State Rd
- 7015 State Rd Unit 17
- 3911 Klusner Ave
- 6937 State Rd
- 7012 State Rd
- 3760 Hetzel Dr
- 3907 Klusner Ave