
Landlord's Agent in 2019
Francisco Rodriguez
Great Western Properties
(331) 777-0629
1 in this area
5 Total Sales


Estimated Value: $155,000 - $202,000
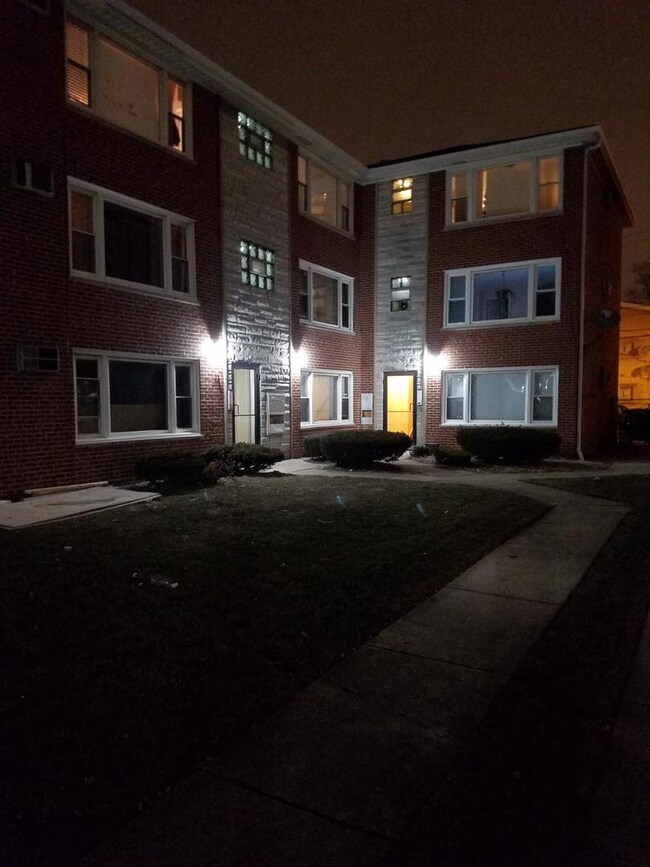
Come live in this beautiful freshly painted updated two bedroom unit with southern exposure that will fill your living room with the right amount of sunshine. The unit offers a kitchen with plenty of counter space, hardwood floors/ surfaces, bluetooth connected bathroom, in complex coin laundry, assigned parking space and storage unit for all your extras. Commuting is made easy with I55, Metra Station and CTA to Midway less than 10 mins away. Also convenient is the newly built elementary school one block away. **Ask your realtor about renters criteria and application process. Come see your new home!**
Last Agent to Rent the Property
Great Western Properties License #475171517 Listed on: 05/30/2019
Last Renter's Agent
Non Member
NON MEMBER
| Date | Buyer | Sale Price | Title Company |
|---|---|---|---|
| Rytlewski Dena | $157,500 | Cti | |
| Pach Leon | $112,000 | -- |
| Date | Status | Borrower | Loan Amount |
|---|---|---|---|
| Open | Rytlewski Dena | $125,840 |
| Date | Event | Price | List to Sale | Price per Sq Ft |
|---|---|---|---|---|
| 07/09/2019 07/09/19 | Rented | $1,100 | 0.0% | -- |
| 06/27/2019 06/27/19 | Price Changed | $1,100 | -8.3% | $2 / Sq Ft |
| 05/30/2019 05/30/19 | For Rent | $1,200 | -- | -- |
| Year | Tax Paid | Tax Assessment Tax Assessment Total Assessment is a certain percentage of the fair market value that is determined by local assessors to be the total taxable value of land and additions on the property. | Land | Improvement |
|---|---|---|---|---|
| 2025 | $1,718 | $12,370 | $1,383 | $10,987 |
| 2024 | $1,718 | $12,370 | $1,383 | $10,987 |
| 2023 | $1,654 | $11,462 | $1,235 | $10,227 |
| 2022 | $1,654 | $11,462 | $1,235 | $10,227 |
| 2021 | $1,635 | $11,460 | $1,234 | $10,226 |
| 2020 | $1,385 | $9,319 | $987 | $8,332 |
| 2019 | $1,394 | $10,370 | $987 | $9,383 |
| 2018 | $1,882 | $12,962 | $987 | $11,975 |
| 2017 | $2,060 | $12,944 | $888 | $12,056 |
| 2016 | $2,092 | $12,944 | $888 | $12,056 |
| 2015 | $1,891 | $12,944 | $888 | $12,056 |
| 2014 | $1,642 | $11,416 | $839 | $10,577 |
| 2013 | $1,598 | $11,416 | $839 | $10,577 |
Landlord's Agent in 2019
Francisco Rodriguez
Great Western Properties
(331) 777-0629
1 in this area
5 Total Sales
N
Tenant's Agent in 2019
Non Member
NON MEMBER
Source: Midwest Real Estate Data (MRED)
MLS Number: MRD10396788
APN: 19-19-114-038-1006
Disclaimer: Certain information contained herein is derived from information provided by parties other than Homes.com. All information provided is deemed reliable, but is not guaranteed to be accurate and should be independently verified.
![]() Based on information submitted to the MLS GRID. All data is obtained from various sources and may not have been verified by broker or MLS GRID. Supplied Open House Information is subject to change without notice. All information should be independently reviewed and verified for accuracy. Properties may or may not be listed by the office/agent presenting the information. Some IDX listings have been excluded from this website.
Based on information submitted to the MLS GRID. All data is obtained from various sources and may not have been verified by broker or MLS GRID. Supplied Open House Information is subject to change without notice. All information should be independently reviewed and verified for accuracy. Properties may or may not be listed by the office/agent presenting the information. Some IDX listings have been excluded from this website.
Based on information submitted to the MLS GRID
Ask me questions while you tour the home.