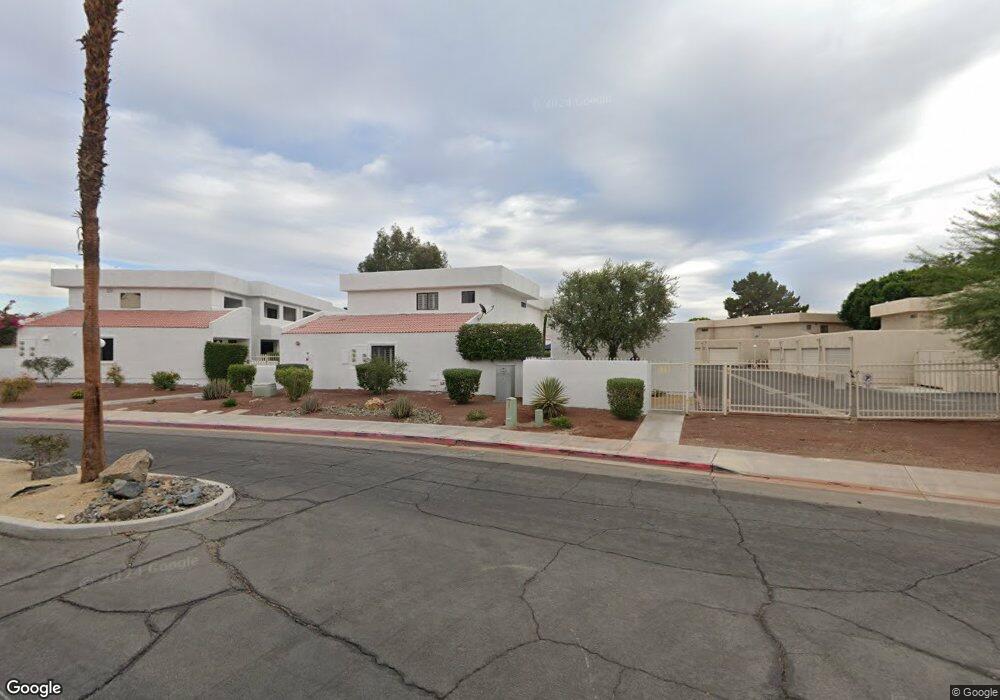
69586 Heather Way Rancho Mirage, CA 92270
Country Club NeighborhoodEstimated Value: $267,000 - $367,000
3
Beds
2
Baths
1,218
Sq Ft
$274/Sq Ft
Est. Value
About This Home
This home is located at 69586 Heather Way, Rancho Mirage, CA 92270 and is currently estimated at $334,096, approximately $274 per square foot. 69586 Heather Way is a home located in Riverside County with nearby schools including Cathedral City Elementary School, Nellie N. Coffman Middle School, and Cathedral City High School.
Ownership History
Date
Name
Owned For
Owner Type
Purchase Details
Closed on
Apr 21, 2011
Sold by
Malinaric Amy M
Bought by
Lafortune Brian J and Lafortune Stephanie E
Current Estimated Value
Purchase Details
Closed on
Dec 7, 2001
Sold by
Roh Susan Marie and Roh Leslie
Bought by
Malinaric Amy M
Home Financials for this Owner
Home Financials are based on the most recent Mortgage that was taken out on this home.
Original Mortgage
$60,000
Interest Rate
7.13%
Purchase Details
Closed on
Feb 19, 1999
Sold by
Hud
Bought by
Roh Susan Marie and Roh Leslie
Home Financials for this Owner
Home Financials are based on the most recent Mortgage that was taken out on this home.
Original Mortgage
$61,247
Interest Rate
6.73%
Mortgage Type
FHA
Purchase Details
Closed on
Aug 24, 1998
Sold by
Blair Scott A
Bought by
Source One Mtg Services Corp
Purchase Details
Closed on
Aug 21, 1998
Sold by
Source One Mtg Services Corp
Bought by
Hud
Create a Home Valuation Report for This Property
The Home Valuation Report is an in-depth analysis detailing your home's value as well as a comparison with similar homes in the area
Home Values in the Area
Average Home Value in this Area
Purchase History
| Date | Buyer | Sale Price | Title Company |
|---|---|---|---|
| Lafortune Brian J | $103,000 | Fidelity National Title Co | |
| Malinaric Amy M | $75,000 | Southland Title Corporation | |
| Roh Susan Marie | $60,000 | Stewart Title Company | |
| Source One Mtg Services Corp | $56,533 | Fidelity National Title | |
| Hud | -- | Fidelity Title |
Source: Public Records
Mortgage History
| Date | Status | Borrower | Loan Amount |
|---|---|---|---|
| Previous Owner | Malinaric Amy M | $60,000 | |
| Previous Owner | Roh Susan Marie | $61,247 |
Source: Public Records
Tax History Compared to Growth
Tax History
| Year | Tax Paid | Tax Assessment Tax Assessment Total Assessment is a certain percentage of the fair market value that is determined by local assessors to be the total taxable value of land and additions on the property. | Land | Improvement |
|---|---|---|---|---|
| 2025 | $2,151 | $131,943 | $32,980 | $98,963 |
| 2023 | $2,151 | $126,821 | $31,700 | $95,121 |
| 2022 | $2,084 | $124,335 | $31,079 | $93,256 |
| 2021 | $2,025 | $121,898 | $30,470 | $91,428 |
| 2020 | $1,940 | $120,649 | $30,158 | $90,491 |
| 2019 | $1,912 | $118,284 | $29,567 | $88,717 |
| 2018 | $1,882 | $115,966 | $28,989 | $86,977 |
| 2017 | $1,858 | $113,693 | $28,421 | $85,272 |
| 2016 | $1,809 | $111,464 | $27,864 | $83,600 |
| 2015 | $1,756 | $109,793 | $27,447 | $82,346 |
| 2014 | $1,745 | $107,644 | $26,910 | $80,734 |
Source: Public Records
Map
Nearby Homes
- 34354 Laura Way
- 105 Shoreline Dr
- 34071 Denise Way
- 127 Via Santo Tomas
- 7 Lake Como Ct
- 34480 Vaquero Rd
- 64 Via Santo Tomas
- 69727 Camino Pacifico
- 5 Lake Louise Ct
- 35070 Maria Rd
- 8 Via Santa Ramona
- 65 Shoreline Dr
- 37 Shoreline Dr
- 59 Via Santo Tomas
- 40 Shoreline Dr
- 69360 Vera Dr
- 13 Lake Tahoe Dr
- 69771 Camino Pacifico
- 69713 Camino Pacifico
- 35001 Vista Del Ladero
- 69592 Heather Way
- 69580 Heather Way
- 69598 Heather Way
- 69591 Cara Way
- 69595 Cara Way
- 69581 Heather Way
- 69599 Cara Way
- 69604 Heather Way
- 69603 Cara Way
- 69585 Heather Way
- 69607 Cara Way
- 69610 Heather Way
- 69589 Heather Way
- 69593 Heather Way
- 69616 Heather Way
- 69597 Heather Way
- 69622 Heather Way
- 69603 Heather Way
- 69617 Cara Way
- 69607 Heather Way