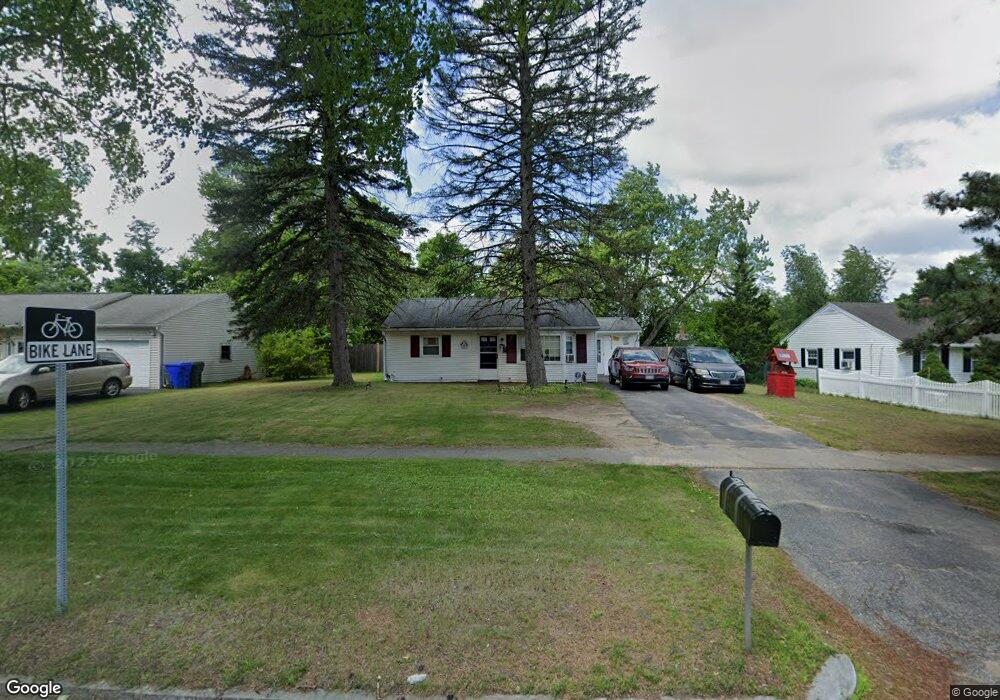
696 Bradley Rd Springfield, MA 01109
Sixteen Acres NeighborhoodEstimated Value: $216,000 - $270,880
2
Beds
1
Bath
946
Sq Ft
$264/Sq Ft
Est. Value
About This Home
This home is located at 696 Bradley Rd, Springfield, MA 01109 and is currently estimated at $249,720, approximately $263 per square foot. 696 Bradley Rd is a home located in Hampden County with nearby schools including Frank H. Freedman School, John J Duggan Middle, and Springfield High School of Science and Technology.
Ownership History
Date
Name
Owned For
Owner Type
Purchase Details
Closed on
Nov 20, 2009
Sold by
Smith Sheila J and Devos Sheila J
Bought by
Barcomb Robert M
Current Estimated Value
Home Financials for this Owner
Home Financials are based on the most recent Mortgage that was taken out on this home.
Original Mortgage
$116,844
Outstanding Balance
$75,746
Interest Rate
4.86%
Mortgage Type
Purchase Money Mortgage
Estimated Equity
$173,974
Create a Home Valuation Report for This Property
The Home Valuation Report is an in-depth analysis detailing your home's value as well as a comparison with similar homes in the area
Home Values in the Area
Average Home Value in this Area
Purchase History
| Date | Buyer | Sale Price | Title Company |
|---|---|---|---|
| Barcomb Robert M | $119,000 | -- |
Source: Public Records
Mortgage History
| Date | Status | Borrower | Loan Amount |
|---|---|---|---|
| Open | Barcomb Robert M | $116,844 |
Source: Public Records
Tax History
| Year | Tax Paid | Tax Assessment Tax Assessment Total Assessment is a certain percentage of the fair market value that is determined by local assessors to be the total taxable value of land and additions on the property. | Land | Improvement |
|---|---|---|---|---|
| 2025 | $3,200 | $204,100 | $52,900 | $151,200 |
| 2024 | $2,950 | $183,700 | $52,900 | $130,800 |
| 2023 | $2,491 | $146,100 | $50,400 | $95,700 |
| 2022 | $2,718 | $144,400 | $50,400 | $94,000 |
| 2021 | $2,376 | $125,700 | $45,800 | $79,900 |
| 2020 | $2,285 | $117,000 | $45,800 | $71,200 |
| 2019 | $2,135 | $108,500 | $45,800 | $62,700 |
| 2018 | $2,194 | $111,500 | $45,800 | $65,700 |
| 2017 | $2,231 | $113,500 | $50,800 | $62,700 |
| 2016 | $2,092 | $106,400 | $50,800 | $55,600 |
| 2015 | $2,069 | $105,200 | $50,800 | $54,400 |
Source: Public Records
Map
Nearby Homes
- 744 Bradley Rd
- 354 Greenaway Dr
- 30 W Hill Rd
- 55 Old Farm Rd
- 61 Monticello Ave
- 297 Breckwood Blvd
- 750 Wilbraham Rd
- 285 Breckwood Blvd
- 647 Plumtree Rd
- 384 Abbott St
- 0
- 509 Plumtree Rd
- 854 Grayson Dr
- 150 Seymour Ave
- 322 Gilbert Ave
- 236 Pondview Dr
- 41 Embury St
- 239 Gresham St
- 187 Lamont St
- 38 Northway Dr
Your Personal Tour Guide
Ask me questions while you tour the home.