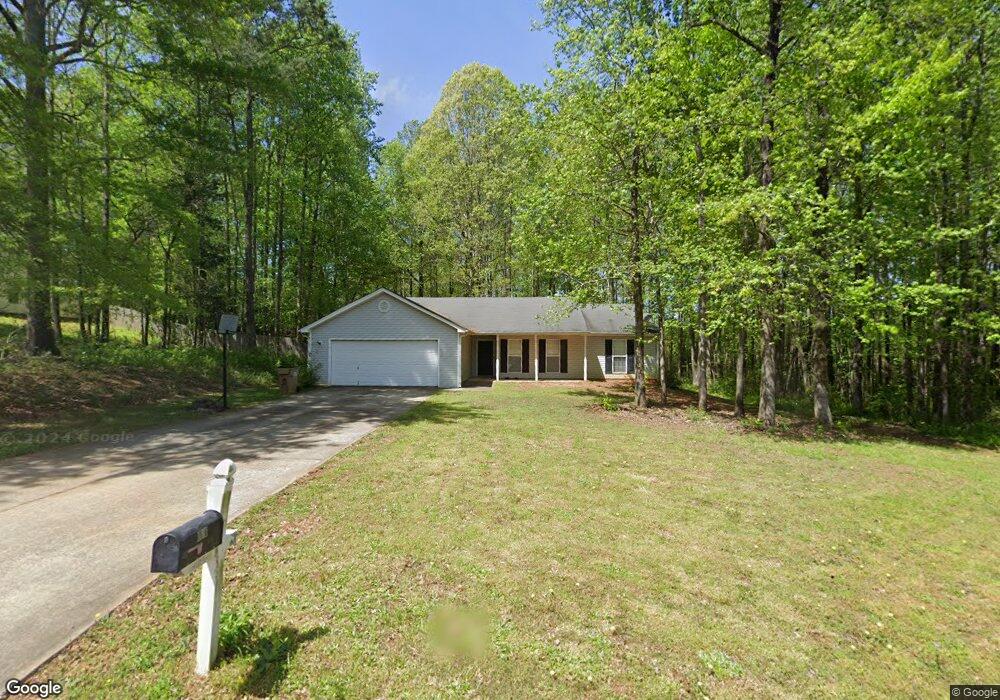
696 Creek Stone Dr Unit 35A Bethlehem, GA 30620
Estimated Value: $287,000 - $321,000
3
Beds
2
Baths
1,270
Sq Ft
$245/Sq Ft
Est. Value
About This Home
This home is located at 696 Creek Stone Dr Unit 35A, Bethlehem, GA 30620 and is currently estimated at $311,060, approximately $244 per square foot. 696 Creek Stone Dr Unit 35A is a home located in Barrow County with nearby schools including Bethlehem Elementary School, Haymon-Morris Middle School, and Apalachee High School.
Ownership History
Date
Name
Owned For
Owner Type
Purchase Details
Closed on
Oct 8, 2021
Sold by
Xiong Moses N
Bought by
Xiong Lee
Current Estimated Value
Home Financials for this Owner
Home Financials are based on the most recent Mortgage that was taken out on this home.
Original Mortgage
$220,500
Outstanding Balance
$201,075
Interest Rate
2.8%
Mortgage Type
New Conventional
Estimated Equity
$109,985
Purchase Details
Closed on
Apr 26, 2019
Sold by
Cummings John A
Bought by
Xiong Moses N
Home Financials for this Owner
Home Financials are based on the most recent Mortgage that was taken out on this home.
Original Mortgage
$174,646
Interest Rate
4%
Mortgage Type
New Conventional
Purchase Details
Closed on
Dec 28, 2001
Sold by
Southfork Homes
Bought by
Cummings John A
Home Financials for this Owner
Home Financials are based on the most recent Mortgage that was taken out on this home.
Original Mortgage
$108,061
Interest Rate
6.85%
Mortgage Type
New Conventional
Purchase Details
Closed on
Aug 10, 2001
Sold by
Sierra Development I
Bought by
Southfork Homes Inc
Purchase Details
Closed on
Jul 27, 2000
Bought by
Sierra Development I
Create a Home Valuation Report for This Property
The Home Valuation Report is an in-depth analysis detailing your home's value as well as a comparison with similar homes in the area
Home Values in the Area
Average Home Value in this Area
Purchase History
| Date | Buyer | Sale Price | Title Company |
|---|---|---|---|
| Xiong Lee | $245,000 | -- | |
| Xiong Moses N | $172,900 | -- | |
| Cummings John A | $105,900 | -- | |
| Southfork Homes Inc | -- | -- | |
| Sierra Development I | -- | -- |
Source: Public Records
Mortgage History
| Date | Status | Borrower | Loan Amount |
|---|---|---|---|
| Open | Xiong Lee | $220,500 | |
| Previous Owner | Xiong Moses N | $174,646 | |
| Previous Owner | Cummings John A | $108,061 |
Source: Public Records
Tax History Compared to Growth
Tax History
| Year | Tax Paid | Tax Assessment Tax Assessment Total Assessment is a certain percentage of the fair market value that is determined by local assessors to be the total taxable value of land and additions on the property. | Land | Improvement |
|---|---|---|---|---|
| 2024 | $2,710 | $106,683 | $23,400 | $83,283 |
| 2023 | $2,715 | $107,083 | $23,400 | $83,683 |
| 2022 | $2,224 | $74,808 | $19,400 | $55,408 |
| 2021 | $2,027 | $64,074 | $16,000 | $48,074 |
| 2020 | $2,030 | $64,074 | $16,000 | $48,074 |
| 2019 | $1,589 | $54,979 | $16,000 | $38,979 |
| 2018 | $1,478 | $51,302 | $14,000 | $37,302 |
| 2017 | $1,106 | $37,996 | $11,600 | $26,396 |
| 2016 | $1,116 | $38,294 | $11,600 | $26,694 |
| 2015 | $1,120 | $38,294 | $11,600 | $26,694 |
| 2014 | $961 | $32,971 | $5,978 | $26,993 |
| 2013 | -- | $31,665 | $5,978 | $25,687 |
Source: Public Records
Map
Nearby Homes
- 763 Moss Side Dr
- 0 Jb Owens Unit 7552902
- 0 Jb Owens Unit 7552891
- 0 Jb Owens Unit LOT 2 - 2.09 ACRES
- 0 Jb Owens Unit LOT 3 - 2.01 ACRES
- 0 Tanners Bridge Rd Unit 10588144
- 637 Sleeping Meadow Ln
- 1071 Covenant Ct
- 286 Meadows Dr
- 103 Camp Ct
- 384 Winslow Ct
- 190 Lokeys Ln
- 303 Ron Dr
- 209 Angie Way
- 1129 Loganville Hwy
- 0 Tanners Bridge Cir Unit 10536031
- 758 Clarence Edwards Rd
- 3153 Lowell Rd
- 468 Grand Oaks Ave
- 1111 Otis Dr
- 696 Creek Stone Dr
- 694 Creek Stone Dr Unit 36A
- 694 Creek Stone Dr Unit 1
- 694 Creek Stone Dr
- 445 Stillwater Dr Unit 1
- 698 Creek Stone Dr
- 698 Creek Stone Dr Unit 1
- 698 Creek Stone Dr
- 0 Creek Stone Dr Unit 7026058
- 692 Creek Stone Dr Unit 37A
- 692 Creek Stone Dr Unit 1
- 692 Creek Stone Dr
- 692 Creek Stone Dr
- 443 Stillwater Dr Unit 1
- 695 Creek Stone Dr
- 444 Stillwater Dr Unit 1
- 1536 Mill Creek Rd
- 697 Creek Stone Dr
- 697 Creek Stone Dr Unit 32
- 693 Creek Stone Dr