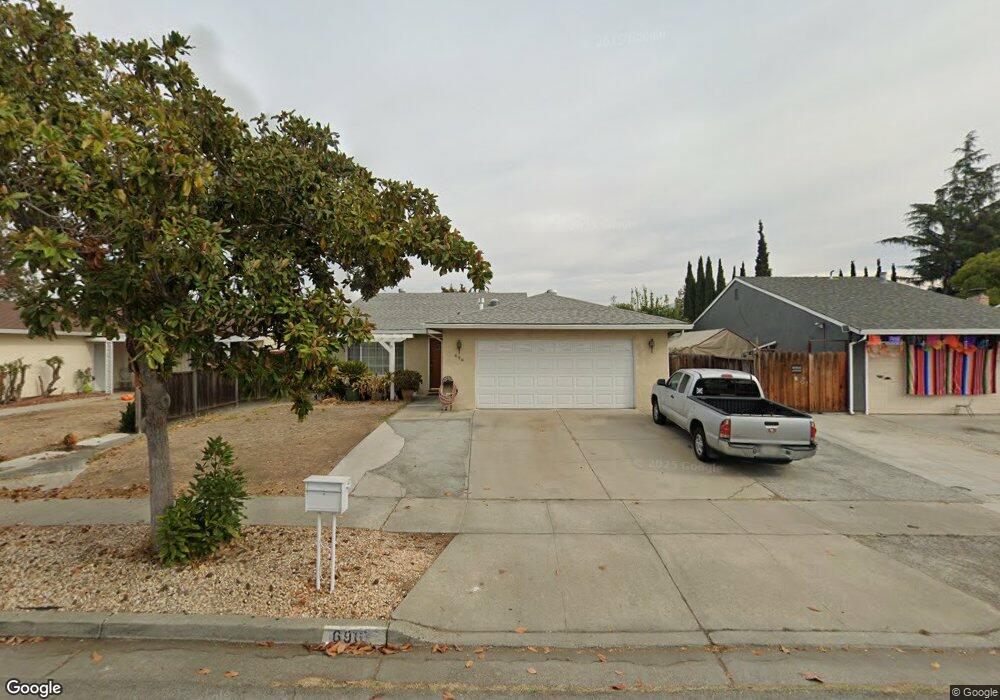
696 Lava Way San Jose, CA 95133
Commodore NeighborhoodEstimated Value: $1,070,000 - $1,398,000
3
Beds
2
Baths
1,420
Sq Ft
$868/Sq Ft
Est. Value
About This Home
This home is located at 696 Lava Way, San Jose, CA 95133 and is currently estimated at $1,233,164, approximately $868 per square foot. 696 Lava Way is a home located in Santa Clara County with nearby schools including Summerdale Elementary School, Piedmont Middle School, and Independence High School.
Ownership History
Date
Name
Owned For
Owner Type
Purchase Details
Closed on
May 2, 2013
Sold by
Chen Pei Ran and Li Shu Xian
Bought by
Chen Pei Ran and Li Shu Xian
Current Estimated Value
Home Financials for this Owner
Home Financials are based on the most recent Mortgage that was taken out on this home.
Original Mortgage
$303,000
Outstanding Balance
$66,087
Interest Rate
3.5%
Mortgage Type
New Conventional
Estimated Equity
$1,167,077
Purchase Details
Closed on
Dec 1, 2010
Sold by
Iskander Sammy and Iskander Sylvia
Bought by
Chen Pei Ran and Li Shu X
Home Financials for this Owner
Home Financials are based on the most recent Mortgage that was taken out on this home.
Original Mortgage
$320,000
Interest Rate
4.18%
Mortgage Type
New Conventional
Purchase Details
Closed on
Oct 17, 1997
Sold by
Crouch Dennis R and Crouch Velma L
Bought by
Iskander Sammy and Iskander Sylvia
Home Financials for this Owner
Home Financials are based on the most recent Mortgage that was taken out on this home.
Original Mortgage
$172,000
Interest Rate
7.49%
Create a Home Valuation Report for This Property
The Home Valuation Report is an in-depth analysis detailing your home's value as well as a comparison with similar homes in the area
Home Values in the Area
Average Home Value in this Area
Purchase History
| Date | Buyer | Sale Price | Title Company |
|---|---|---|---|
| Chen Pei Ran | -- | Fidelity National Title Co | |
| Chen Pei Ran | $420,000 | Old Republic Title Company | |
| Iskander Sammy | $215,000 | Fidelity National Title Co |
Source: Public Records
Mortgage History
| Date | Status | Borrower | Loan Amount |
|---|---|---|---|
| Open | Chen Pei Ran | $303,000 | |
| Closed | Chen Pei Ran | $320,000 | |
| Previous Owner | Iskander Sammy | $172,000 |
Source: Public Records
Tax History Compared to Growth
Tax History
| Year | Tax Paid | Tax Assessment Tax Assessment Total Assessment is a certain percentage of the fair market value that is determined by local assessors to be the total taxable value of land and additions on the property. | Land | Improvement |
|---|---|---|---|---|
| 2025 | $8,210 | $538,081 | $322,850 | $215,231 |
| 2024 | $8,210 | $527,531 | $316,520 | $211,011 |
| 2023 | $8,050 | $517,188 | $310,314 | $206,874 |
| 2022 | $8,014 | $507,048 | $304,230 | $202,818 |
| 2021 | $7,743 | $497,107 | $298,265 | $198,842 |
| 2020 | $7,494 | $492,011 | $295,207 | $196,804 |
| 2019 | $7,208 | $482,365 | $289,419 | $192,946 |
| 2018 | $7,101 | $472,908 | $283,745 | $189,163 |
| 2017 | $7,135 | $463,636 | $278,182 | $185,454 |
| 2016 | $6,837 | $454,546 | $272,728 | $181,818 |
| 2015 | $6,756 | $447,719 | $268,632 | $179,087 |
| 2014 | $6,125 | $438,949 | $263,370 | $175,579 |
Source: Public Records
Map
Nearby Homes
- 633 Easton Dr
- 2369 Mabury Rd
- 709 Whitewater Ct Unit 44
- 674 Galleon Ct
- 2420 Kita Ln
- 2432 Kita Ln
- 2580 Gimelli Way
- 571 Apricot Way
- 559 Apricot Way
- 2599 Easton Ln Unit 108
- 2599 Easton Ln Unit 109
- 750 Fruit Ranch Loop
- 832 N Jackson Ave
- 12280 Mabury Rd
- 2623 Gimelli Place Unit 139
- 714 N Capitol Ave
- 2328 Mossdale Way
- 1957 Cape Horn Dr
- 370 Englert Ct
- 825 N Capitol Ave Unit 4