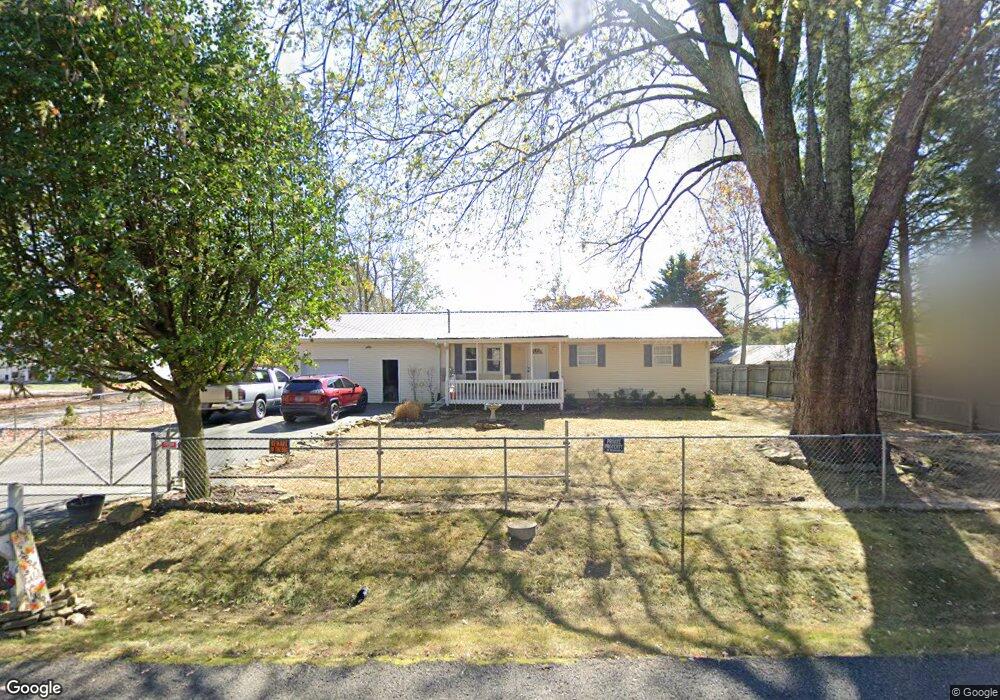
696 Miller Rd Signal Mountain, TN 37377
Estimated Value: $90,994 - $196,000
2
Beds
1
Bath
960
Sq Ft
$158/Sq Ft
Est. Value
About This Home
This home is located at 696 Miller Rd, Signal Mountain, TN 37377 and is currently estimated at $151,749, approximately $158 per square foot. 696 Miller Rd is a home located in Sequatchie County with nearby schools including Griffith Elementary School, Sequatchie County Middle School, and Sequatchie County High School.
Ownership History
Date
Name
Owned For
Owner Type
Purchase Details
Closed on
Jan 29, 2010
Sold by
Graham David
Bought by
Hampton Charles
Current Estimated Value
Home Financials for this Owner
Home Financials are based on the most recent Mortgage that was taken out on this home.
Original Mortgage
$88,775
Outstanding Balance
$59,135
Interest Rate
5.16%
Estimated Equity
$92,614
Purchase Details
Closed on
Oct 12, 2009
Sold by
Federal Home Loan Mortgage Corporation
Bought by
Graham David
Purchase Details
Closed on
Jun 18, 2009
Sold by
Sims Jeffrey A
Bought by
Federal Home Loan Mortgage Corporation
Purchase Details
Closed on
Nov 25, 2006
Sold by
Jp Morgan Chase Bank
Bought by
Sims Jeffrey A
Purchase Details
Closed on
Jun 1, 2006
Bought by
Jp Morgan Chase Bank Trust Fidelity National
Purchase Details
Closed on
Feb 2, 2001
Sold by
Brenda Stephens
Bought by
Curtis Margaret A
Purchase Details
Closed on
Dec 19, 1997
Bought by
Stephens Brenda
Create a Home Valuation Report for This Property
The Home Valuation Report is an in-depth analysis detailing your home's value as well as a comparison with similar homes in the area
Home Values in the Area
Average Home Value in this Area
Purchase History
| Date | Buyer | Sale Price | Title Company |
|---|---|---|---|
| Hampton Charles | $86,500 | -- | |
| Graham David | $17,700 | -- | |
| Federal Home Loan Mortgage Corporation | -- | -- | |
| Sims Jeffrey A | $55,000 | -- | |
| Jp Morgan Chase Bank Trust Fidelity National | $57,600 | -- | |
| Curtis Margaret A | $17,860 | -- | |
| Stephens Brenda | $21,500 | -- |
Source: Public Records
Mortgage History
| Date | Status | Borrower | Loan Amount |
|---|---|---|---|
| Open | Stephens Brenda | $88,775 |
Source: Public Records
Tax History Compared to Growth
Tax History
| Year | Tax Paid | Tax Assessment Tax Assessment Total Assessment is a certain percentage of the fair market value that is determined by local assessors to be the total taxable value of land and additions on the property. | Land | Improvement |
|---|---|---|---|---|
| 2024 | $381 | $20,725 | $4,150 | $16,575 |
| 2023 | $381 | $20,725 | $4,150 | $16,575 |
| 2022 | $281 | $11,500 | $2,400 | $9,100 |
| 2021 | $281 | $11,500 | $2,400 | $9,100 |
| 2020 | $281 | $11,500 | $2,400 | $9,100 |
| 2019 | $281 | $11,500 | $2,400 | $9,100 |
| 2018 | $281 | $11,500 | $2,400 | $9,100 |
| 2017 | $281 | $11,500 | $2,400 | $9,100 |
| 2016 | $313 | $12,175 | $2,875 | $9,300 |
| 2015 | $314 | $12,225 | $2,875 | $9,350 |
| 2014 | $314 | $12,225 | $2,875 | $9,350 |
Source: Public Records
Map
Nearby Homes
- 720 Miller Rd
- 342 Miller Rd
- 316 Brock Creek Trail
- 435 County Line Rd
- 763 U S 127
- 2435 Blue Mist Dr
- 78 Gray Rd
- 4644 Signal Forest Dr
- 28 Lynn Rd
- 3014 Edgewood Dr
- Meridian Plan at The Sanctuary at Signal Forest
- Willow Creek Plan at The Sanctuary at Signal Forest
- Lynden Plan at The Sanctuary at Signal Forest
- Pine Mountain Plan at The Sanctuary at Signal Forest
- New Haven Plan at The Sanctuary at Signal Forest
- Magnolia Lane Plan at The Sanctuary at Signal Forest
- Laurel Plan at The Sanctuary at Signal Forest
- Wellesley Plan at The Sanctuary at Signal Forest
- Peyton Plan at The Sanctuary at Signal Forest
- Peachtree Plan at The Sanctuary at Signal Forest