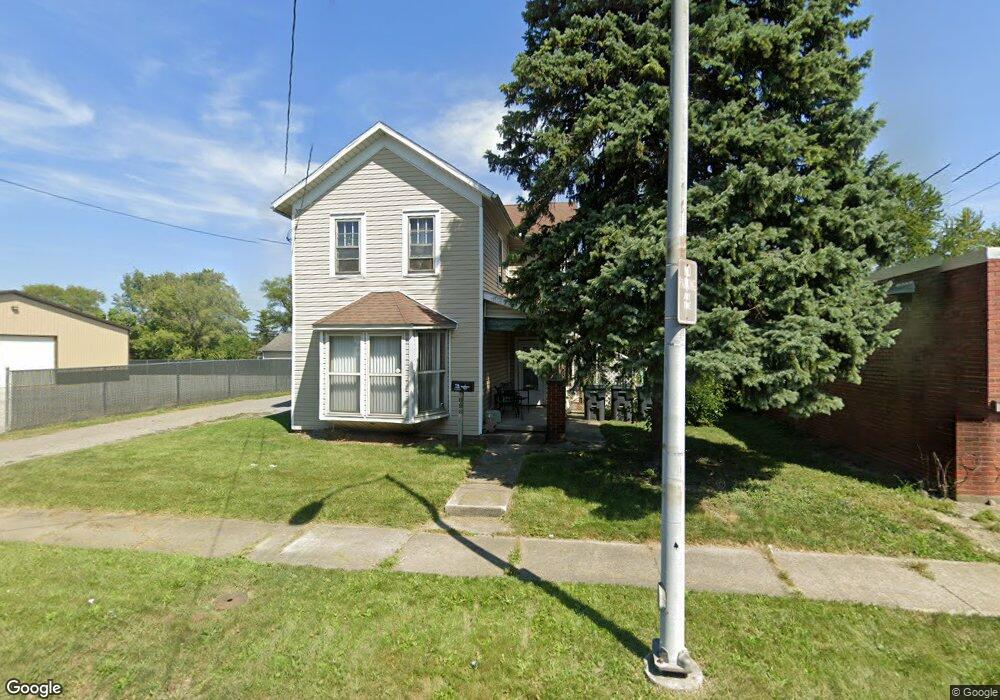
696 N Jackson St Lima, OH 45801
Eastside Lima NeighborhoodEstimated Value: $78,000 - $112,000
4
Beds
1
Bath
1,696
Sq Ft
$56/Sq Ft
Est. Value
About This Home
This home is located at 696 N Jackson St, Lima, OH 45801 and is currently estimated at $95,541, approximately $56 per square foot. 696 N Jackson St is a home located in Allen County with nearby schools including Independence Elementary School, Lima North Middle School, and Lima West Middle School.
Ownership History
Date
Name
Owned For
Owner Type
Purchase Details
Closed on
Feb 28, 2005
Sold by
Rollins Lillian Frances
Bought by
Rollins Cheryl A and Rollins Don
Current Estimated Value
Home Financials for this Owner
Home Financials are based on the most recent Mortgage that was taken out on this home.
Original Mortgage
$54,810
Outstanding Balance
$27,224
Interest Rate
5.71%
Mortgage Type
FHA
Estimated Equity
$68,317
Purchase Details
Closed on
May 10, 2002
Sold by
Rahrig Greg A
Bought by
Rollins Lillian F
Home Financials for this Owner
Home Financials are based on the most recent Mortgage that was taken out on this home.
Original Mortgage
$47,025
Interest Rate
9.75%
Mortgage Type
New Conventional
Purchase Details
Closed on
Jan 1, 1990
Bought by
Rhoades Claude E
Create a Home Valuation Report for This Property
The Home Valuation Report is an in-depth analysis detailing your home's value as well as a comparison with similar homes in the area
Home Values in the Area
Average Home Value in this Area
Purchase History
| Date | Buyer | Sale Price | Title Company |
|---|---|---|---|
| Rollins Cheryl A | $67,500 | None Available | |
| Rollins Lillian F | $49,500 | -- | |
| Rhoades Claude E | -- | -- |
Source: Public Records
Mortgage History
| Date | Status | Borrower | Loan Amount |
|---|---|---|---|
| Open | Rollins Cheryl A | $54,810 | |
| Previous Owner | Rollins Lillian F | $47,025 |
Source: Public Records
Tax History
| Year | Tax Paid | Tax Assessment Tax Assessment Total Assessment is a certain percentage of the fair market value that is determined by local assessors to be the total taxable value of land and additions on the property. | Land | Improvement |
|---|---|---|---|---|
| 2024 | $645 | $19,990 | $1,610 | $18,380 |
| 2023 | $810 | $19,040 | $1,540 | $17,500 |
| 2022 | $623 | $19,040 | $1,540 | $17,500 |
| 2021 | $649 | $19,040 | $1,540 | $17,500 |
| 2020 | $493 | $17,820 | $1,510 | $16,310 |
| 2019 | $493 | $17,820 | $1,510 | $16,310 |
| 2018 | $517 | $17,820 | $1,510 | $16,310 |
| 2017 | $494 | $17,820 | $1,510 | $16,310 |
| 2016 | $502 | $17,820 | $1,510 | $16,310 |
| 2015 | $509 | $17,820 | $1,510 | $16,310 |
| 2014 | $420 | $16,030 | $1,610 | $14,420 |
| 2013 | $409 | $16,030 | $1,610 | $14,420 |
Source: Public Records
Map
Nearby Homes
- 922 N Jefferson St
- 514 & 516 N Elizabeth St
- 919 N Main St
- 735 N Elizabeth St
- 316 Ewing Ave
- 416 Hazel Ave
- 406 Ewing Ave
- 435 Marian Ave
- 325 N McDonel St
- 129 S Pine St
- 145 S Pine St
- 1021 N McDonel St
- 934 N Metcalf St
- 806 Bellefontaine Ave
- 5 Unit Package
- 627 Brice Ave
- 431 N Metcalf St
- 812 Christopher Dr
- 557 W Ashton Ave
- 735 Brice Ave
- 702 N Jackson St
- 688 N Jackson St
- 684 N Jackson St
- 717 N Jefferson St
- 719 N Jefferson St
- 713 N Jefferson St
- 721 N Jefferson St
- 713 Jefferson N 713 12
- 676 N Jackson St
- 711 N Jefferson St
- 725 N Jefferson St
- 701 N Jackson St
- 670 N Jackson St
- 707 N Jefferson St
- 671 N Jefferson St
- 668 N Jackson St
- 663 N Jefferson St
- 661 N Jefferson St
Your Personal Tour Guide
Ask me questions while you tour the home.