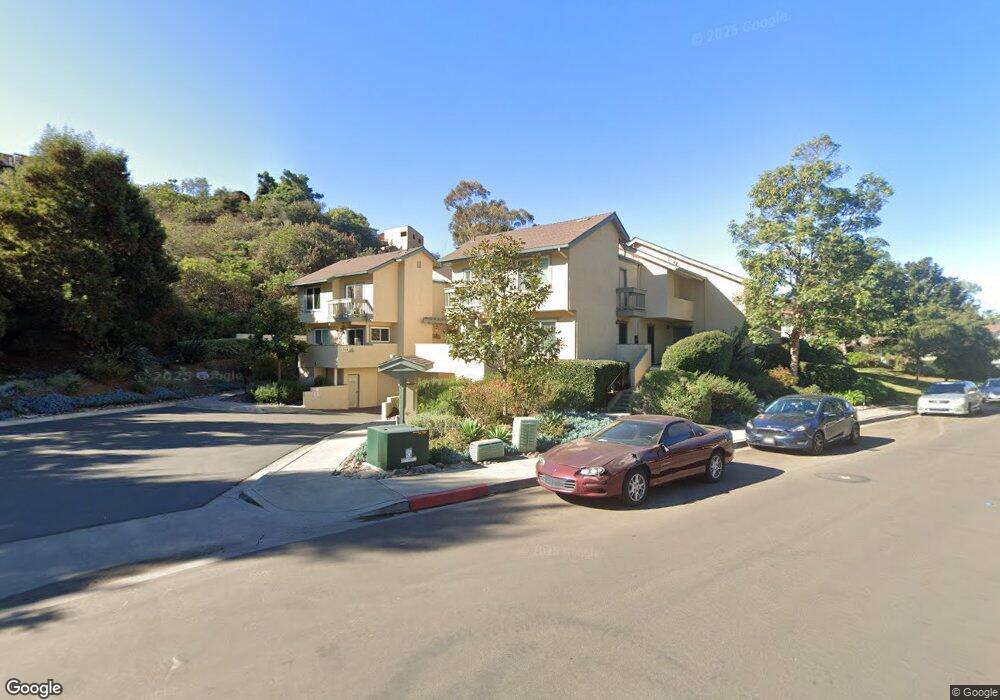
6969 Park Mesa Way Unit 101 San Diego, CA 92111
Linda Vista NeighborhoodEstimated Value: $690,000 - $720,000
2
Beds
2
Baths
1,224
Sq Ft
$576/Sq Ft
Est. Value
About This Home
This home is located at 6969 Park Mesa Way Unit 101, San Diego, CA 92111 and is currently estimated at $704,806, approximately $575 per square foot. 6969 Park Mesa Way Unit 101 is a home located in San Diego County with nearby schools including Chesterton Elementary School, Montgomery Middle School, and San Diego Cooperative Charter School.
Ownership History
Date
Name
Owned For
Owner Type
Purchase Details
Closed on
Jan 17, 2024
Sold by
Patton Sarah J
Bought by
Sarah J Patton Trust and Patton
Current Estimated Value
Purchase Details
Closed on
Oct 4, 2011
Sold by
Patton Joan S
Bought by
Patton Sarah J
Purchase Details
Closed on
Jan 20, 1999
Sold by
Patton Joan S
Bought by
Patton Sarah J
Purchase Details
Closed on
Dec 11, 1998
Sold by
Patton Joan S
Bought by
Patton Sarah J
Purchase Details
Closed on
Jun 19, 1998
Sold by
Zilius Charlene S
Bought by
Patton Sarah J and Patton Joan S
Home Financials for this Owner
Home Financials are based on the most recent Mortgage that was taken out on this home.
Original Mortgage
$57,500
Interest Rate
6.9%
Mortgage Type
Purchase Money Mortgage
Purchase Details
Closed on
Aug 25, 1986
Create a Home Valuation Report for This Property
The Home Valuation Report is an in-depth analysis detailing your home's value as well as a comparison with similar homes in the area
Home Values in the Area
Average Home Value in this Area
Purchase History
| Date | Buyer | Sale Price | Title Company |
|---|---|---|---|
| Sarah J Patton Trust | -- | None Listed On Document | |
| Patton Sarah J | -- | None Available | |
| Patton Sarah J | -- | -- | |
| Patton Sarah J | -- | -- | |
| Patton Sarah J | $147,500 | California Title Company | |
| -- | $102,000 | -- |
Source: Public Records
Mortgage History
| Date | Status | Borrower | Loan Amount |
|---|---|---|---|
| Previous Owner | Patton Sarah J | $57,500 |
Source: Public Records
Tax History Compared to Growth
Tax History
| Year | Tax Paid | Tax Assessment Tax Assessment Total Assessment is a certain percentage of the fair market value that is determined by local assessors to be the total taxable value of land and additions on the property. | Land | Improvement |
|---|---|---|---|---|
| 2025 | $2,755 | $231,211 | $35,605 | $195,606 |
| 2024 | $2,755 | $226,678 | $34,907 | $191,771 |
| 2023 | $2,693 | $222,234 | $34,223 | $188,011 |
| 2022 | $2,619 | $217,877 | $33,552 | $184,325 |
| 2021 | $2,597 | $213,606 | $32,895 | $180,711 |
| 2020 | $2,563 | $211,417 | $32,558 | $178,859 |
| 2019 | $2,514 | $207,272 | $31,920 | $175,352 |
| 2018 | $2,351 | $203,209 | $31,295 | $171,914 |
| 2017 | $80 | $199,226 | $30,682 | $168,544 |
| 2016 | $2,253 | $195,321 | $30,081 | $165,240 |
| 2015 | $2,219 | $192,388 | $29,630 | $162,758 |
| 2014 | $2,183 | $188,620 | $29,050 | $159,570 |
Source: Public Records
Map
Nearby Homes
- 6929 Park Mesa Way Unit 126
- 7016 Park Mesa Way
- 2767 Lancha St
- 2818 Nye St
- 3047 Old Bridgeport Way
- 2868-70 Preece St
- 3014 Old Bridgeport Way
- 2675 Comstock St
- 3120 Old Bridgeport Way
- 6728 Thomson Ct
- 6737 Thomson Ct
- 3226 Old Heather Rd
- 3218 Old Bridgeport Way
- 7555 Linda Vista Unit 9
- 3413 Rollsreach Dr
- 3266 Ashford St Unit M
- 3230 Ashford St Unit A
- 3230 Ashford St Unit B
- 3298 Old Heather Rd
- 7613 Family Cir Unit LU5
- 6969 Park Mesa Way Unit 99
- 6969 Park Mesa Way Unit 104
- 6969 Park Mesa Way Unit 103
- 6969 Park Mesa Way Unit 102
- 6969 Park Mesa Way Unit 100
- 6959 Park Mesa Way Unit 98
- 6959 Park Mesa Way Unit 97
- 6959 Park Mesa Way Unit 96
- 6959 Park Mesa Way Unit 95
- 6959 Park Mesa Way Unit 94
- 6959 Park Mesa Way Unit 93
- 6949 Park Mesa Way
- 6949 Park Mesa Way Unit 110
- 6949 Park Mesa Way Unit 109
- 6949 Park Mesa Way Unit 108
- 6949 Park Mesa Way Unit 107
- 6949 Park Mesa Way Unit 106
- 6949 Park Mesa Way Unit 105
- 6939 Park Mesa Way Unit 122
- 6939 Park Mesa Way Unit 121