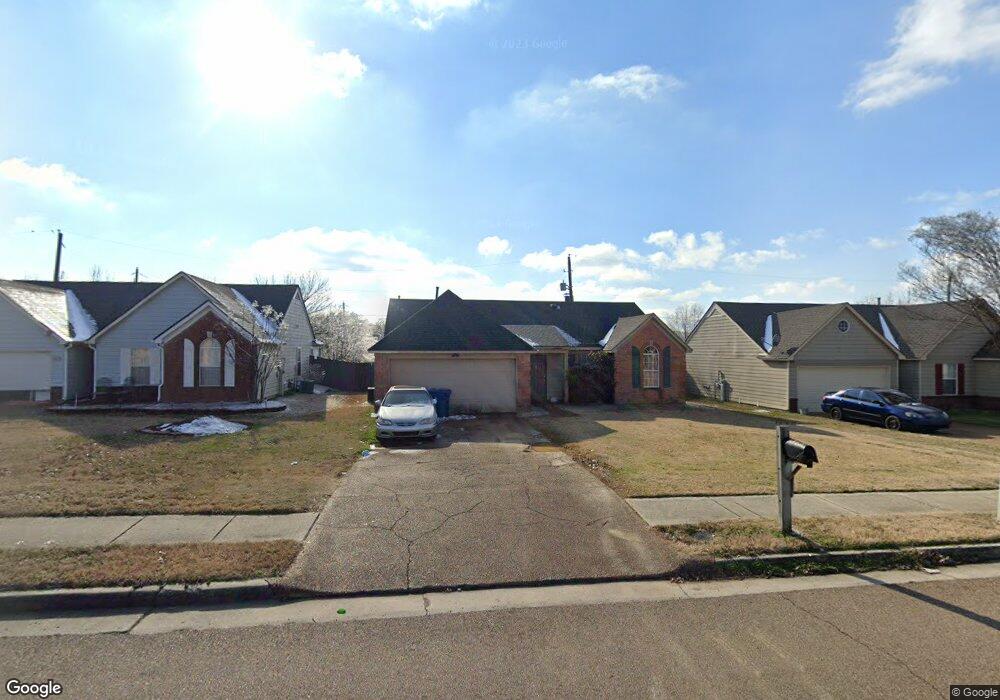
6969 Raleigh Lagrange Rd Cordova, TN 38018
Cordova NeighborhoodEstimated Value: $203,000 - $213,000
3
Beds
2
Baths
1,233
Sq Ft
$169/Sq Ft
Est. Value
About This Home
This home is located at 6969 Raleigh Lagrange Rd, Cordova, TN 38018 and is currently estimated at $208,843, approximately $169 per square foot. 6969 Raleigh Lagrange Rd is a home located in Shelby County with nearby schools including Dexter Elementary School, Dexter Middle School, and Cordova High School.
Ownership History
Date
Name
Owned For
Owner Type
Purchase Details
Closed on
Nov 24, 2004
Sold by
Tennessee Investment Properties
Bought by
Herrera Alfonsina
Current Estimated Value
Home Financials for this Owner
Home Financials are based on the most recent Mortgage that was taken out on this home.
Original Mortgage
$82,500
Outstanding Balance
$43,513
Interest Rate
6.75%
Mortgage Type
Purchase Money Mortgage
Estimated Equity
$165,330
Purchase Details
Closed on
May 14, 2004
Sold by
Brewer Timothy and Brewer Deidra L
Bought by
Tennessee Investment Properties
Purchase Details
Closed on
Aug 8, 1997
Sold by
Richerson W V
Bought by
Paragon Properties Llc
Home Financials for this Owner
Home Financials are based on the most recent Mortgage that was taken out on this home.
Original Mortgage
$89,519
Interest Rate
7.5%
Mortgage Type
FHA
Create a Home Valuation Report for This Property
The Home Valuation Report is an in-depth analysis detailing your home's value as well as a comparison with similar homes in the area
Home Values in the Area
Average Home Value in this Area
Purchase History
| Date | Buyer | Sale Price | Title Company |
|---|---|---|---|
| Herrera Alfonsina | $107,500 | Realty Title | |
| Tennessee Investment Properties | -- | -- | |
| Paragon Properties Llc | -- | Southern Escrow Title Compan | |
| Brewer Timothy | $88,900 | Southern Escrow Title Compan | |
| Paragon Properties Llc | -- | Southern Escrow Title Compan |
Source: Public Records
Mortgage History
| Date | Status | Borrower | Loan Amount |
|---|---|---|---|
| Open | Herrera Alfonsina | $82,500 | |
| Previous Owner | Brewer Timothy | $89,519 | |
| Closed | Herrera Alfonsina | $25,000 |
Source: Public Records
Tax History Compared to Growth
Tax History
| Year | Tax Paid | Tax Assessment Tax Assessment Total Assessment is a certain percentage of the fair market value that is determined by local assessors to be the total taxable value of land and additions on the property. | Land | Improvement |
|---|---|---|---|---|
| 2025 | $1,203 | $47,275 | $6,500 | $40,775 |
| 2024 | $1,203 | $35,500 | $5,325 | $30,175 |
| 2023 | $1,203 | $35,500 | $5,325 | $30,175 |
| 2022 | $1,203 | $35,500 | $5,325 | $30,175 |
| 2021 | $1,225 | $35,500 | $5,325 | $30,175 |
| 2020 | $993 | $24,525 | $5,325 | $19,200 |
| 2019 | $993 | $24,525 | $5,325 | $19,200 |
| 2018 | $993 | $24,525 | $5,325 | $19,200 |
| 2017 | $1,008 | $24,525 | $5,325 | $19,200 |
| 2016 | $992 | $22,700 | $0 | $0 |
| 2014 | $992 | $22,700 | $0 | $0 |
Source: Public Records
Map
Nearby Homes
- 7035 S Estacada Way
- 1382 Exbury Dr
- 6916 Lagrange Pines Rd
- 6838 Lagrange Cir N
- 6774 Whitten Pine Dr
- 7194 Charlton Way
- 6884 Wrigley Dr
- 6880 Wrigley Dr
- 6890 Century Oaks Dr
- 7407 Lost Grove Ln
- 7412 Lost Trail Dr
- 7410 Appling Rain Dr
- 7426 Lost Trail Dr
- 7520 Crystal Lake Dr
- 1520 Cider House Ln
- 1595 Dexter Grove Ct Unit E105
- 1595 Dexter Grove Ct Unit D101
- 1321 Winter Springs Ln
- 6452 Macon Rd
- 1277 Winter Springs Ln
- 6961 Raleigh Lagrange Rd
- 6977 Raleigh Lagrange Rd
- 6957 Raleigh Lagrange Rd
- 6981 Raleigh Lagrange Rd
- 6966 Lagrange Cir N
- 6970 Lagrange Cir N
- 6991 Raleigh Lagrange Rd
- 6949 Raleigh Lagrange Rd
- 6982 Lagrange Hill Rd
- 6970 Lagrange Hill Rd
- 6976 Lagrange Hill Rd
- 6958 Lagrange Cir N
- 6995 S Beringer Dr
- 6980 Lagrange Cir N
- 6999 S Beringer Dr
- 6941 Raleigh Lagrange Rd
- 6954 Lagrange Cir N
- 7005 S Beringer Dr
- 6955 Lagrange Cir N
- 6979 Lagrange Cir N