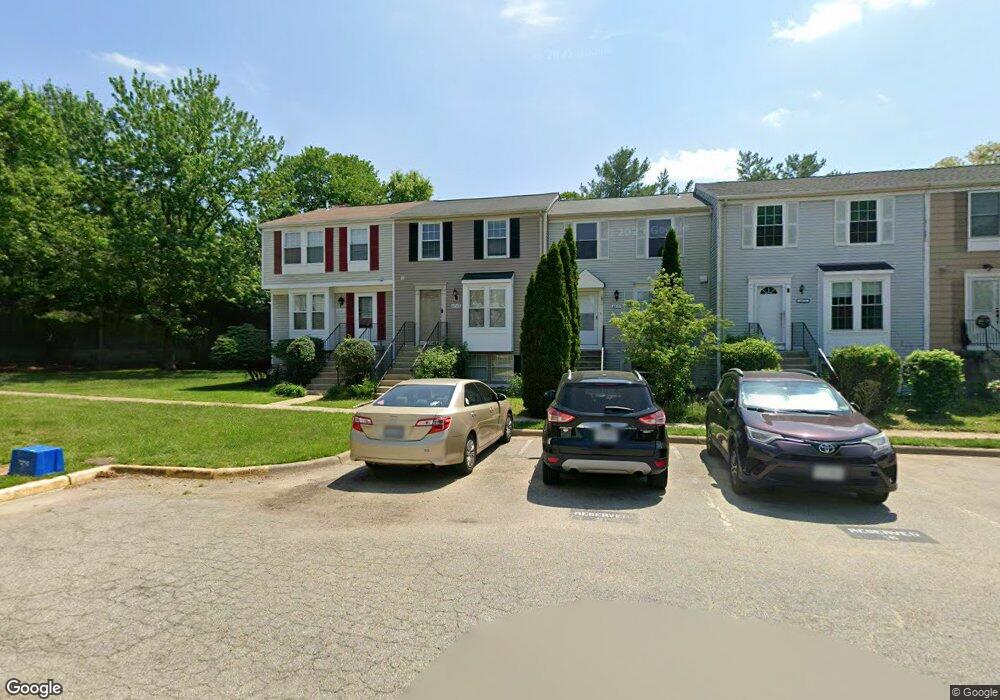
6969 Villa Del Rey Ct Springfield, VA 22150
Estimated Value: $494,535 - $547,000
3
Beds
3
Baths
1,126
Sq Ft
$461/Sq Ft
Est. Value
About This Home
This home is located at 6969 Villa Del Rey Ct, Springfield, VA 22150 and is currently estimated at $518,884, approximately $460 per square foot. 6969 Villa Del Rey Ct is a home located in Fairfax County with nearby schools including Garfield Elementary School, Key Middle, and Lewis High School.
Ownership History
Date
Name
Owned For
Owner Type
Purchase Details
Closed on
Oct 26, 2007
Sold by
Baig Ahmed
Bought by
Razo Michel Z and Cruz Iii,Ricardo S
Current Estimated Value
Home Financials for this Owner
Home Financials are based on the most recent Mortgage that was taken out on this home.
Original Mortgage
$330,000
Outstanding Balance
$209,332
Interest Rate
6.43%
Mortgage Type
New Conventional
Estimated Equity
$309,552
Purchase Details
Closed on
May 17, 2004
Sold by
Kaur Japinder
Bought by
Baig Ahmed A
Home Financials for this Owner
Home Financials are based on the most recent Mortgage that was taken out on this home.
Original Mortgage
$212,000
Interest Rate
5.47%
Mortgage Type
New Conventional
Purchase Details
Closed on
Aug 31, 2000
Sold by
Rapipong Nussorn
Bought by
Singh Hartej
Home Financials for this Owner
Home Financials are based on the most recent Mortgage that was taken out on this home.
Original Mortgage
$127,800
Interest Rate
8.16%
Create a Home Valuation Report for This Property
The Home Valuation Report is an in-depth analysis detailing your home's value as well as a comparison with similar homes in the area
Home Values in the Area
Average Home Value in this Area
Purchase History
| Date | Buyer | Sale Price | Title Company |
|---|---|---|---|
| Razo Michel Z | $330,000 | -- | |
| Baig Ahmed A | $265,000 | -- | |
| Singh Hartej | $142,000 | -- |
Source: Public Records
Mortgage History
| Date | Status | Borrower | Loan Amount |
|---|---|---|---|
| Open | Razo Michel Z | $330,000 | |
| Previous Owner | Baig Ahmed A | $212,000 | |
| Previous Owner | Singh Hartej | $127,800 |
Source: Public Records
Tax History Compared to Growth
Tax History
| Year | Tax Paid | Tax Assessment Tax Assessment Total Assessment is a certain percentage of the fair market value that is determined by local assessors to be the total taxable value of land and additions on the property. | Land | Improvement |
|---|---|---|---|---|
| 2025 | $5,323 | $459,840 | $155,000 | $304,840 |
| 2024 | $5,323 | $459,450 | $155,000 | $304,450 |
| 2023 | $4,864 | $431,000 | $145,000 | $286,000 |
| 2022 | $4,168 | $364,520 | $110,000 | $254,520 |
| 2021 | $4,278 | $364,520 | $110,000 | $254,520 |
| 2020 | $4,255 | $359,520 | $105,000 | $254,520 |
| 2019 | $4,023 | $339,900 | $95,000 | $244,900 |
| 2018 | $3,645 | $316,960 | $90,000 | $226,960 |
| 2017 | $3,432 | $295,590 | $85,000 | $210,590 |
| 2016 | $3,424 | $295,590 | $85,000 | $210,590 |
| 2015 | $3,299 | $295,590 | $85,000 | $210,590 |
| 2014 | $2,948 | $264,720 | $75,000 | $189,720 |
Source: Public Records
Map
Nearby Homes
- 7206 Lavender Ln
- 6928 Ruskin St
- 6821 Ridgeway Dr
- 6828 Ridgeway Dr
- 7215 Oriole Ave
- 7039 Calamo St
- 6824 Constance Dr
- 6806 Ruskin St
- 7401 Loughboro Ln
- 6719 Ruskin St
- 6547 Milva Ln
- 6631 Rockleigh Way
- 7119 Barry Rd
- 7230 Lackawanna Dr
- 6507 Byron Ave
- 6221 Hibbling Ave
- 6558 Lochleigh Ct
- 7714 Shootingstar Dr
- 6469 Rockshire Ct
- 6461 Rockshire Ct
- 6971 Villa Del Rey Ct
- 6967 Villa Del Rey Ct
- 6973 Villa Del Rey Ct
- 6975 Villa Del Rey Ct
- 6977 Villa Del Rey Ct
- 6979 Villa Del Rey Ct
- 6961 Villa Del Rey Ct
- 6963 Villa Del Rey Ct
- 6959 Villa Del Rey Ct
- 6965 Villa Del Rey Ct
- 6957 Villa Del Rey Ct
- 6981 Villa Del Rey Ct
- 6955 Villa Del Rey Ct
- 6953 Villa Del Rey Ct
- 6983 Villa Del Rey Ct
- 6951 Villa Del Rey Ct
- 6949 Villa Del Rey Ct
- 6985 Villa Del Rey Ct
- 6935 Villa Del Rey Ct
- 6937 Villa Del Rey Ct