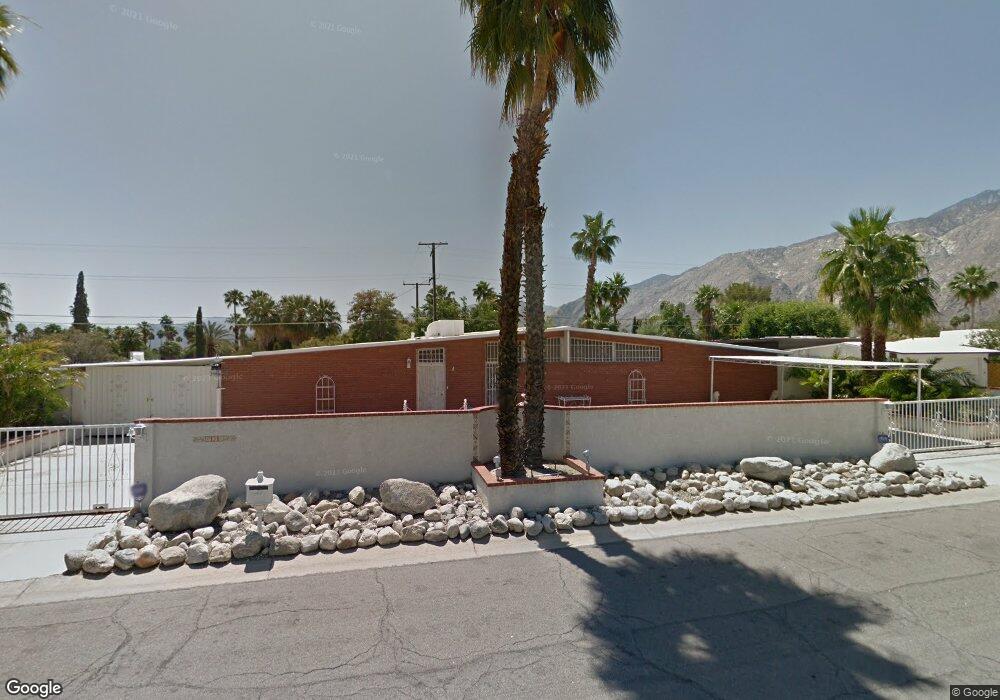
697 E Alexander Way Unit 3 Palm Springs, CA 92262
Racquet Club Estates NeighborhoodEstimated Value: $677,000 - $1,072,000
3
Beds
2
Baths
1,985
Sq Ft
$438/Sq Ft
Est. Value
About This Home
This home is located at 697 E Alexander Way Unit 3, Palm Springs, CA 92262 and is currently estimated at $870,187, approximately $438 per square foot. 697 E Alexander Way Unit 3 is a home located in Riverside County with nearby schools including Vista Del Monte Elementary School, Raymond Cree Middle School, and Palm Springs High School.
Ownership History
Date
Name
Owned For
Owner Type
Purchase Details
Closed on
Nov 8, 2002
Sold by
Shreve Stephen L
Bought by
Shreve Stephen L and Shreve Loretta C
Current Estimated Value
Purchase Details
Closed on
Mar 5, 2002
Sold by
Shreve Loretta C
Bought by
Shreve Stephen L
Home Financials for this Owner
Home Financials are based on the most recent Mortgage that was taken out on this home.
Original Mortgage
$206,250
Outstanding Balance
$86,580
Interest Rate
7.13%
Mortgage Type
Stand Alone First
Estimated Equity
$783,607
Purchase Details
Closed on
Dec 7, 1995
Sold by
Security Trust Company
Bought by
Shreve Stephen L and Shreve Loretta C
Home Financials for this Owner
Home Financials are based on the most recent Mortgage that was taken out on this home.
Original Mortgage
$45,000
Interest Rate
7.48%
Mortgage Type
Seller Take Back
Purchase Details
Closed on
Sep 14, 1995
Sold by
Austin David C
Bought by
Shreve Stephen L and Shreve Loretta C
Create a Home Valuation Report for This Property
The Home Valuation Report is an in-depth analysis detailing your home's value as well as a comparison with similar homes in the area
Home Values in the Area
Average Home Value in this Area
Purchase History
| Date | Buyer | Sale Price | Title Company |
|---|---|---|---|
| Shreve Stephen L | -- | -- | |
| Shreve Stephen L | -- | Chicago Title Co | |
| Shreve Stephen L | $75,000 | First American Title Ins Co | |
| Shreve Stephen L | -- | -- |
Source: Public Records
Mortgage History
| Date | Status | Borrower | Loan Amount |
|---|---|---|---|
| Open | Shreve Stephen L | $206,250 | |
| Closed | Shreve Stephen L | $45,000 |
Source: Public Records
Tax History Compared to Growth
Tax History
| Year | Tax Paid | Tax Assessment Tax Assessment Total Assessment is a certain percentage of the fair market value that is determined by local assessors to be the total taxable value of land and additions on the property. | Land | Improvement |
|---|---|---|---|---|
| 2025 | $2,849 | $223,696 | $39,022 | $184,674 |
| 2023 | $2,849 | $215,010 | $37,507 | $177,503 |
| 2022 | $2,899 | $210,795 | $36,772 | $174,023 |
| 2021 | $2,843 | $206,662 | $36,051 | $170,611 |
| 2020 | $2,723 | $204,544 | $35,682 | $168,862 |
| 2019 | $2,677 | $200,534 | $34,983 | $165,551 |
| 2018 | $2,628 | $196,603 | $34,298 | $162,305 |
| 2017 | $2,588 | $192,749 | $33,626 | $159,123 |
| 2016 | $2,516 | $188,970 | $32,967 | $156,003 |
| 2015 | $2,404 | $186,133 | $32,473 | $153,660 |
| 2014 | $2,378 | $182,489 | $31,838 | $150,651 |
Source: Public Records
Map
Nearby Homes
- 2197 Jacques Dr
- 784 E Alexander Way
- 600 E Alexander Way
- 2101 N Berne Dr
- 2272 N Starr Rd
- 971 E Alexander Way
- 2211 N Starr Rd
- 888 E El Conquistador
- 2023 N Via Miraleste Unit 1022
- 1033 E Via Escuela
- 444 E Glen Cir N
- 2146 N Blando Rd
- 1031 E El Conquistador
- 1055 E Racquet Club Rd
- 2252 N Indian Canyon Dr Unit E
- 1041 E El Conquistador
- 576 E Desert Holly Cir
- 205 The River
- 1865 N Via Miraleste Unit 1822
- 325 E Via Escuela Unit 324
- 717 E Alexander Way
- 679 E Alexander Way
- 2198 N Berne Dr
- 666 E Alexander Way
- 680 E Alexander Way
- 753 E Alexander Way
- 2185 Jacques Dr
- 2186 N Berne Dr
- 2194 Jacques Dr
- 650 E Alexander Way
- 750 E Alexander Way
- 750 E Alexander Way Unit ID1034643P
- 750 E Alexander Way
- 2372 N Trail Cir
- 2335 N Rock Cir
- 2186 Jacques Dr
- 2167 Jacques Dr
- 783 E Alexander Way
- 605 E Alexander Way
- 2390 N Trail Cir