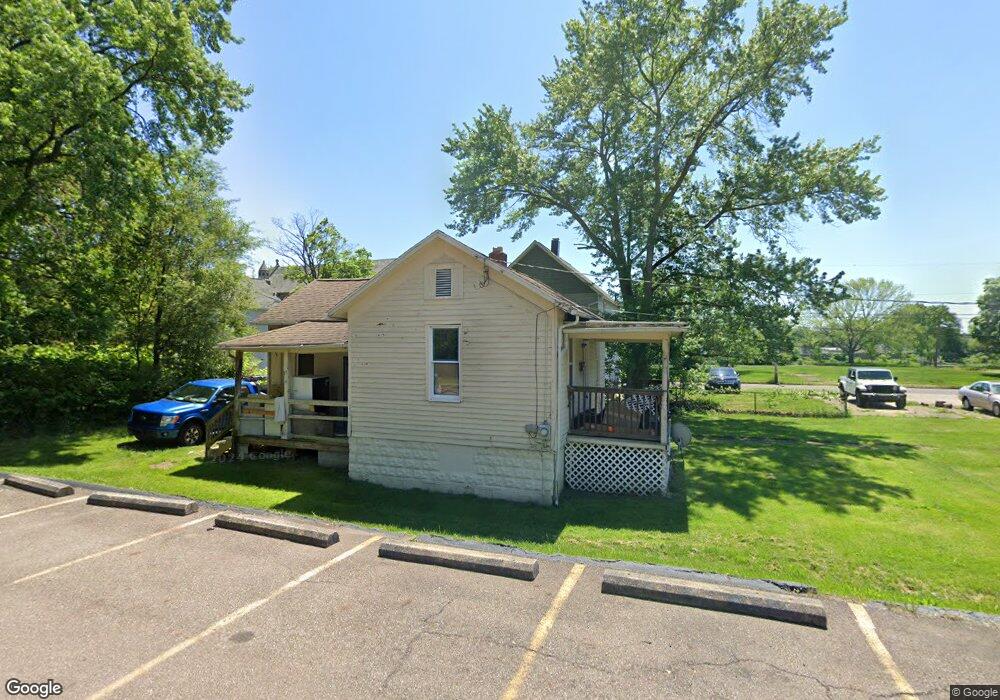
697 Sherman St Unit 699 Akron, OH 44311
Downtown Akron NeighborhoodEstimated Value: $69,000 - $195,163
6
Beds
3
Baths
3,502
Sq Ft
$40/Sq Ft
Est. Value
About This Home
This home is located at 697 Sherman St Unit 699, Akron, OH 44311 and is currently estimated at $141,541, approximately $40 per square foot. 697 Sherman St Unit 699 is a home located in Summit County with nearby schools including North High School, Main Preparatory Academy, and St. Bernard-St. Mary Elementary School.
Ownership History
Date
Name
Owned For
Owner Type
Purchase Details
Closed on
Mar 2, 2023
Sold by
Rasmark Llc
Bought by
Premier Homes
Current Estimated Value
Purchase Details
Closed on
Dec 18, 2019
Sold by
Acip Properties Llc
Bought by
Catt Christopher B
Purchase Details
Closed on
Sep 6, 2019
Sold by
F & L Partnership
Bought by
Acip Properties Llc
Create a Home Valuation Report for This Property
The Home Valuation Report is an in-depth analysis detailing your home's value as well as a comparison with similar homes in the area
Home Values in the Area
Average Home Value in this Area
Purchase History
| Date | Buyer | Sale Price | Title Company |
|---|---|---|---|
| Premier Homes | $200,000 | None Listed On Document | |
| Catt Christopher B | $33,750 | Lawyers Title Agency | |
| Acip Properties Llc | $97,621 | Fidelity National Title |
Source: Public Records
Tax History Compared to Growth
Tax History
| Year | Tax Paid | Tax Assessment Tax Assessment Total Assessment is a certain percentage of the fair market value that is determined by local assessors to be the total taxable value of land and additions on the property. | Land | Improvement |
|---|---|---|---|---|
| 2025 | $3,319 | $61,068 | $9,317 | $51,751 |
| 2024 | $3,319 | $61,068 | $9,317 | $51,751 |
| 2023 | $3,319 | $61,068 | $9,317 | $51,751 |
| 2022 | $2,813 | $40,443 | $6,171 | $34,272 |
| 2021 | $2,799 | $40,191 | $6,171 | $34,020 |
| 2020 | $2,758 | $40,190 | $6,170 | $34,020 |
| 2019 | $1,738 | $21,080 | $4,780 | $16,300 |
| 2018 | $1,718 | $21,080 | $4,780 | $16,300 |
| 2017 | $1,773 | $21,080 | $4,780 | $16,300 |
| 2016 | $1,774 | $21,080 | $4,780 | $16,300 |
| 2015 | $1,773 | $21,080 | $4,780 | $16,300 |
| 2014 | $1,760 | $21,080 | $4,780 | $16,300 |
| 2013 | $1,887 | $21,860 | $4,780 | $17,080 |
Source: Public Records
Map
Nearby Homes
- 678 Sumner St Unit 682
- 668 Sherman St
- 653 Sumner St
- 281 E Thornton St
- 253,257,261,263 E Thornton St
- 687 Allyn St
- 628, 634 & 636 Sumner St Unit 6 units
- 294 Sumner Ct
- 298 Sumner Ct
- 386 E Voris St
- 370 E Thornton St
- 656 Kling St Unit 2
- 590 and 596 Sumner St
- 833 Sherman St
- 841 Grant St
- 380 Cross St Unit 382
- 442 E Thornton St
- 685 Brown St
- 633 Brown St
- 634 Spicer St
- 703 Sherman St
- 699 Sherman St Unit 699
- 295 E Voris St
- 685 Sherman St
- 299 E Voris St
- 301 E Voris St
- 301 E Voris St Unit 2
- 301 E Voris St
- 301 E Voris St Unit 2-up
- 698 Sherman St
- 679 Sherman St
- 702 Sumner St
- 686 Sherman St
- 710 Sumner St
- 675 Sherman St
- 265 E Voris St
- 700 Sumner St
- 694 Sherman St
- 690 Sherman St
- 682 Sherman St