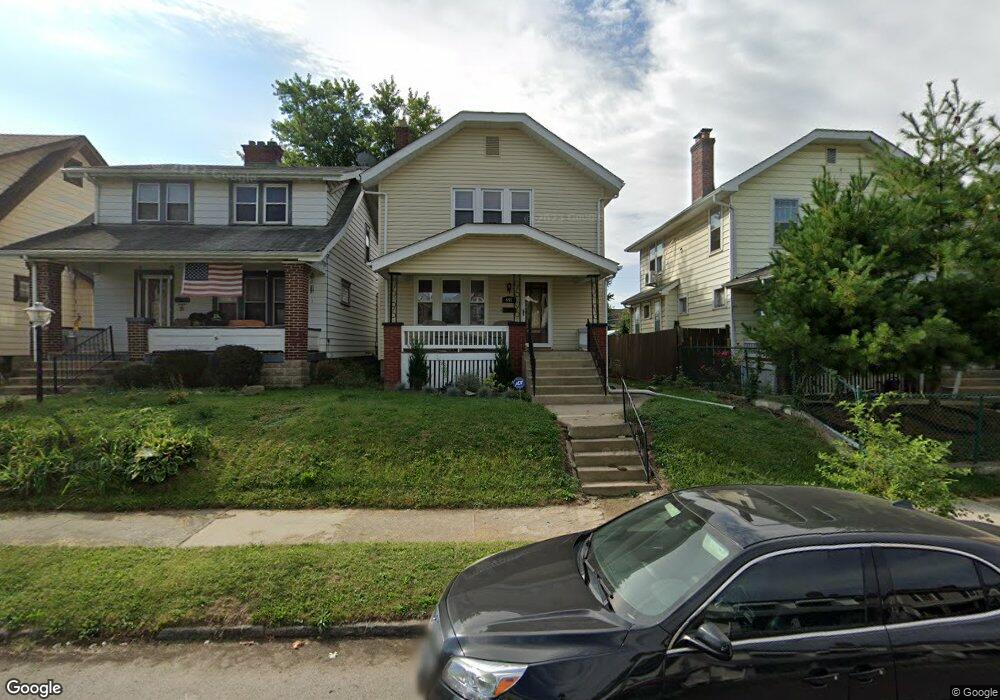
697 Thurman Ave Columbus, OH 43206
Karns Park NeighborhoodEstimated Value: $189,000 - $310,000
3
Beds
2
Baths
1,276
Sq Ft
$194/Sq Ft
Est. Value
About This Home
This home is located at 697 Thurman Ave, Columbus, OH 43206 and is currently estimated at $247,747, approximately $194 per square foot. 697 Thurman Ave is a home located in Franklin County with nearby schools including Lincoln Park Elementary School, South High School, and St Pauls Lutheran School.
Ownership History
Date
Name
Owned For
Owner Type
Purchase Details
Closed on
Jul 15, 2010
Sold by
Hillshafer Matty and Evergreen Strategic Ventures L
Bought by
Nelson Bryan K
Current Estimated Value
Home Financials for this Owner
Home Financials are based on the most recent Mortgage that was taken out on this home.
Original Mortgage
$39,961
Interest Rate
5.5%
Mortgage Type
FHA
Purchase Details
Closed on
May 10, 2010
Sold by
The Bank Of New York Mellon
Bought by
Hillshafer Matty and Evergreen Strategic Ventures L
Purchase Details
Closed on
Dec 22, 2009
Sold by
Caramazza Augustine P and Caramazza Fernanda
Bought by
The Bank Of New York Mellon
Purchase Details
Closed on
Dec 11, 1964
Bought by
Caramaza Augustine P
Create a Home Valuation Report for This Property
The Home Valuation Report is an in-depth analysis detailing your home's value as well as a comparison with similar homes in the area
Home Values in the Area
Average Home Value in this Area
Purchase History
| Date | Buyer | Sale Price | Title Company |
|---|---|---|---|
| Nelson Bryan K | $40,500 | Title First | |
| Hillshafer Matty | $28,000 | None Available | |
| The Bank Of New York Mellon | $46,000 | Attorney | |
| Caramaza Augustine P | -- | -- |
Source: Public Records
Mortgage History
| Date | Status | Borrower | Loan Amount |
|---|---|---|---|
| Previous Owner | Nelson Bryan K | $39,961 |
Source: Public Records
Tax History Compared to Growth
Tax History
| Year | Tax Paid | Tax Assessment Tax Assessment Total Assessment is a certain percentage of the fair market value that is determined by local assessors to be the total taxable value of land and additions on the property. | Land | Improvement |
|---|---|---|---|---|
| 2024 | $3,200 | $71,300 | $21,530 | $49,770 |
| 2023 | $3,159 | $71,295 | $21,525 | $49,770 |
| 2022 | $1,184 | $22,830 | $4,800 | $18,030 |
| 2021 | $1,186 | $22,830 | $4,800 | $18,030 |
| 2020 | $1,188 | $22,830 | $4,800 | $18,030 |
| 2019 | $1,107 | $18,240 | $3,990 | $14,250 |
| 2018 | $1,083 | $18,240 | $3,990 | $14,250 |
| 2017 | $1,138 | $18,240 | $3,990 | $14,250 |
| 2016 | $1,169 | $17,650 | $3,330 | $14,320 |
| 2015 | $1,061 | $17,650 | $3,330 | $14,320 |
| 2014 | $1,064 | $17,650 | $3,330 | $14,320 |
| 2013 | $552 | $18,550 | $3,500 | $15,050 |
Source: Public Records
Map
Nearby Homes
- 693 Thurman Ave
- 1263 Heyl Ave
- 650 E Mithoff St
- 739 Thurman Ave
- 735-737 E Mithoff St
- 1240 S 17th St
- 1062 E Deshler Ave
- 0 Gilbert St
- 621-627 E Gates St
- 524 Thurman Ave
- 798 E Mithoff St
- 565 E Mithoff St
- 721 Hanford St Unit 721-723
- 1191 S 22nd St Unit 1185
- 706 Frebis Ave
- 554 Hanford St
- 853 Thurman Ave
- 1178 Wager St
- 515 E Mithoff St
- 1274 Wager St
- 701 Thurman Ave
- 689 Thurman Ave
- 705 Thurman Ave
- 685 Thurman Ave
- 711 Thurman Ave
- 679 Thurman Ave
- 690 E Mithoff St
- 686 E Mithoff St
- 694 E Mithoff St
- 675 Thurman Ave
- 682 E Mithoff St
- 702 Thurman Ave Unit 704
- 702 Thurman Ave Unit 4
- 678 E Mithoff St
- 700 E Mithoff St
- 698 E Mithoff St Unit 700
- 698 E Mithoff St
- 721 Thurman Ave
- 702-704 Thurman Ave
- 700 Thurman Ave