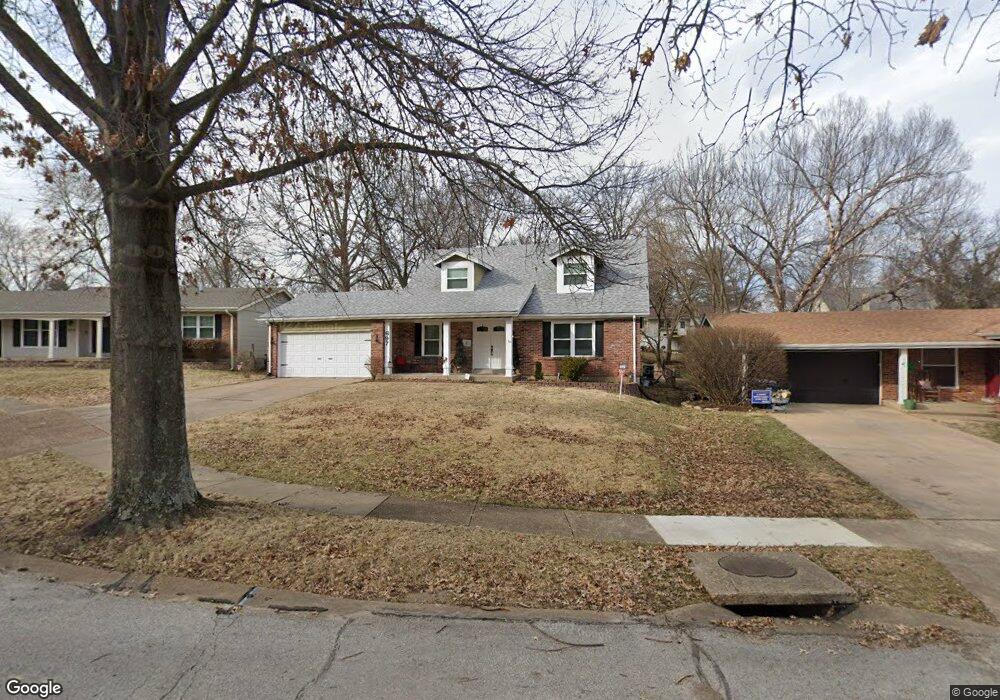
697 Walnut Point Ct Ballwin, MO 63021
Estimated Value: $372,000 - $424,000
3
Beds
3
Baths
2,065
Sq Ft
$195/Sq Ft
Est. Value
About This Home
This home is located at 697 Walnut Point Ct, Ballwin, MO 63021 and is currently estimated at $402,403, approximately $194 per square foot. 697 Walnut Point Ct is a home located in St. Louis County with nearby schools including Woerther Elementary School, Selvidge Middle School, and Marquette Sr. High School.
Ownership History
Date
Name
Owned For
Owner Type
Purchase Details
Closed on
Jan 20, 2022
Sold by
Flanagan Colin M and Flanagan Catherine G
Bought by
Flanagan Colin M
Current Estimated Value
Home Financials for this Owner
Home Financials are based on the most recent Mortgage that was taken out on this home.
Original Mortgage
$254,185
Outstanding Balance
$233,652
Interest Rate
3.22%
Mortgage Type
New Conventional
Estimated Equity
$168,751
Purchase Details
Closed on
Jun 29, 2012
Sold by
Landsbaum Scott G and Shanker Michele N
Bought by
Flanagan Colin M and Flanagan Catherine G
Home Financials for this Owner
Home Financials are based on the most recent Mortgage that was taken out on this home.
Original Mortgage
$131,200
Interest Rate
3.81%
Mortgage Type
New Conventional
Purchase Details
Closed on
May 20, 2012
Sold by
Shanker Michelle N and Shanker Steven L
Bought by
Shanker Michelen
Home Financials for this Owner
Home Financials are based on the most recent Mortgage that was taken out on this home.
Original Mortgage
$131,200
Interest Rate
3.81%
Mortgage Type
New Conventional
Create a Home Valuation Report for This Property
The Home Valuation Report is an in-depth analysis detailing your home's value as well as a comparison with similar homes in the area
Home Values in the Area
Average Home Value in this Area
Purchase History
| Date | Buyer | Sale Price | Title Company |
|---|---|---|---|
| Flanagan Colin M | -- | Us Title | |
| Flanagan Colin M | -- | Us Title | |
| Flanagan Colin M | $164,000 | Investors Title Co Clayton | |
| Shanker Michelen | $30,000 | None Available |
Source: Public Records
Mortgage History
| Date | Status | Borrower | Loan Amount |
|---|---|---|---|
| Open | Flanagan Colin M | $254,185 | |
| Closed | Flanagan Colin M | $254,185 | |
| Previous Owner | Flanagan Colin M | $131,200 |
Source: Public Records
Tax History
| Year | Tax Paid | Tax Assessment Tax Assessment Total Assessment is a certain percentage of the fair market value that is determined by local assessors to be the total taxable value of land and additions on the property. | Land | Improvement |
|---|---|---|---|---|
| 2025 | $4,325 | $67,550 | $29,890 | $37,660 |
| 2024 | $4,325 | $61,790 | $19,930 | $41,860 |
| 2023 | $4,325 | $61,790 | $19,930 | $41,860 |
| 2022 | $3,720 | $49,350 | $23,260 | $26,090 |
| 2021 | $3,692 | $49,350 | $23,260 | $26,090 |
| 2020 | $3,659 | $46,630 | $19,930 | $26,700 |
| 2019 | $3,674 | $46,630 | $19,930 | $26,700 |
| 2018 | $3,531 | $42,240 | $12,450 | $29,790 |
| 2017 | $3,447 | $42,240 | $12,450 | $29,790 |
| 2016 | $3,169 | $37,320 | $9,960 | $27,360 |
| 2015 | $3,105 | $37,320 | $9,960 | $27,360 |
| 2014 | $2,905 | $34,030 | $5,550 | $28,480 |
Source: Public Records
Map
Nearby Homes
- 713 Village Wood Ct
- 677 Rustic Valley Dr
- 400 Woodrun Dr
- 510 Charoak Dr
- 643 Nanceen Ct
- 725 Whispering Forest Dr
- 318 Statewood Dr
- 325 Fox Village Ct
- 760 Woodside Trails Dr Unit 203
- 533 Golfwood Dr
- 279 Aspen Village Dr
- 604 Pine Ridge Trails Ct Unit 202
- 857 Village Meadow Dr
- 873 Woodside Trails Dr Unit 853
- 332 Remington Way Dr
- 589 Wetherby Terrace Dr
- 247 Ramsey Ln
- 1110 Kiefer Creek Rd
- 847 Palm Bay Dr
- 15927 Forest Valley Dr
- 695 Walnut Point Ct
- 699 Walnut Point Ct
- 694 Woodrun Ct
- 696 Woodrun Ct
- 692 Woodrun Ct
- 693 Walnut Point Ct
- 379 Walnut Point Ct
- 690 Woodrun Ct
- 698 Walnut Point Ct
- 698 Woodrun Ct
- 380 Walnut Point Ct
- 691 Walnut Point Ct
- 381 Walnut Point Ct
- 688 Woodrun Ct
- 383 Cedar Run Dr
- 383 Walnut Point Ct
- 382 Walnut Point Ct
- 689 Walnut Point Ct
- 695 Woodrun Ct
- 686 Woodrun Ct
Your Personal Tour Guide
Ask me questions while you tour the home.