Estimated Value: $368,204 - $380,000
3
Beds
3
Baths
1,682
Sq Ft
$223/Sq Ft
Est. Value
About This Home
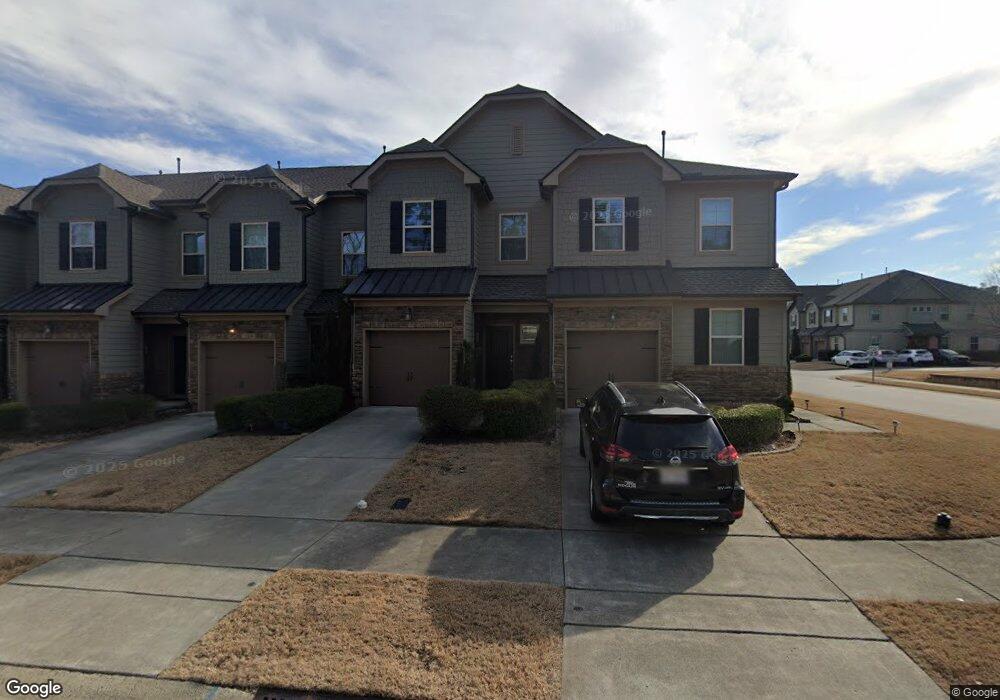
This home is located at 697 Wickham Ridge Rd Unit 155, Apex, NC 27539 and is currently estimated at $374,401, approximately $222 per square foot. 697 Wickham Ridge Rd Unit 155 is a home located in Wake County with nearby schools including Lufkin Road Middle School, Apex Friendship High School, and Pine Springs Prep Academy.
Ownership History
Date
Name
Owned For
Owner Type
Purchase Details
Closed on
Jun 7, 2017
Sold by
Carlton Properties Llc
Bought by
Llabona Michael
Current Estimated Value
Home Financials for this Owner
Home Financials are based on the most recent Mortgage that was taken out on this home.
Original Mortgage
$210,000
Outstanding Balance
$174,724
Interest Rate
4.03%
Mortgage Type
New Conventional
Estimated Equity
$199,677
Purchase Details
Closed on
Mar 21, 2017
Sold by
Heusdain Jean Luc
Bought by
Carlton Properties Llc
Purchase Details
Closed on
Jan 26, 2015
Sold by
Ashton Raleigh Residential Llc
Bought by
Heusdain Jean Lue
Home Financials for this Owner
Home Financials are based on the most recent Mortgage that was taken out on this home.
Original Mortgage
$161,600
Interest Rate
3.9%
Mortgage Type
New Conventional
Create a Home Valuation Report for This Property
The Home Valuation Report is an in-depth analysis detailing your home's value as well as a comparison with similar homes in the area
Purchase History
| Date | Buyer | Sale Price | Title Company |
|---|---|---|---|
| Llabona Michael | $240,000 | None Available | |
| Carlton Properties Llc | $210,000 | None Available | |
| Heusdain Jean Lue | $202,000 | None Available |
Source: Public Records
Mortgage History
| Date | Status | Borrower | Loan Amount |
|---|---|---|---|
| Open | Llabona Michael | $210,000 | |
| Previous Owner | Heusdain Jean Lue | $161,600 |
Source: Public Records
Tax History
| Year | Tax Paid | Tax Assessment Tax Assessment Total Assessment is a certain percentage of the fair market value that is determined by local assessors to be the total taxable value of land and additions on the property. | Land | Improvement |
|---|---|---|---|---|
| 2025 | $3,381 | $384,978 | $90,000 | $294,978 |
| 2024 | $3,306 | $384,978 | $90,000 | $294,978 |
Source: Public Records
Map
Nearby Homes
- 694 Wickham Ridge Rd
- 680 Wickham Ridge Rd
- 738 Wickham Ridge Rd
- 5501 Bobbitt Rd
- 213 October Glory Ln
- 104 Minnifer Ct
- 2344 Horton Park Dr
- 2353 Horton Park Dr
- 2340 Horton Park Dr
- 3340 Colby Chase Dr Unit Lot 2
- 2336 Horton Park Dr
- 2349 Horton Park Dr
- 3332 Colby Chase Dr Unit Lot 3
- 2345 Horton Park Dr
- 2332 Horton Park Dr
- 2333 Horton Park Dr
- 2321 Horton Park Dr
- 2408 Merion Creek Dr
- 102 Gallent Hedge Trail
- 2283 Horton Park Dr
- 697 Wickham Ridge Rd
- 695 Wickham Ridge Rd
- 699 Wickham Ridge Rd
- 693 Wickham Ridge Rd Unit 153
- 693 Wickham Ridge Rd
- 691 Wickham Ridge Rd
- 2415 Baslow Dr
- 689 Wickham Ridge Rd
- 2417 Baslow Dr
- 2419 Baslow Dr
- 701 Wickham Ridge Rd
- 683 Wickham Ridge Rd
- 2421 Baslow Dr
- 703 Wickham Ridge Rd
- 2423 Baslow Dr
- 681 Wickham Ridge Rd Unit 149
- 681 Wickham Ridge Rd
- 696 Wickham Ridge Rd Unit 138
- 696 Wickham Ridge Rd
- 698 Wickham Ridge Rd Unit 137
Your Personal Tour Guide
Ask me questions while you tour the home.