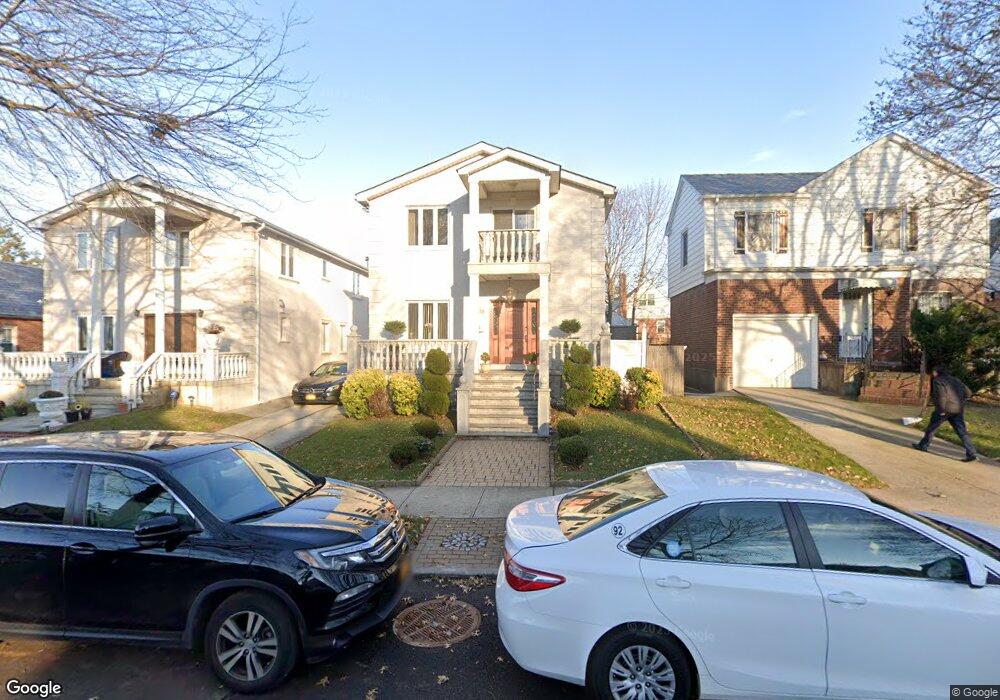
6973 183rd St Fresh Meadows, NY 11365
Fresh Meadows NeighborhoodEstimated Value: $1,365,038 - $1,787,000
--
Bed
--
Bath
1,926
Sq Ft
$840/Sq Ft
Est. Value
About This Home
This home is located at 6973 183rd St, Fresh Meadows, NY 11365 and is currently estimated at $1,617,260, approximately $839 per square foot. 6973 183rd St is a home located in Queens County with nearby schools including P.S. 173 - Fresh Meadow, George J. Ryan Middle School 216, and Holy Family School.
Ownership History
Date
Name
Owned For
Owner Type
Purchase Details
Closed on
Oct 20, 2016
Sold by
Wong Karl
Bought by
Karl Wong Revocable Living Trust and Wong As Trustee Karl
Current Estimated Value
Purchase Details
Closed on
Aug 11, 2008
Sold by
Panoyan Hakop and Panoyan Panos
Bought by
Wong Karl
Home Financials for this Owner
Home Financials are based on the most recent Mortgage that was taken out on this home.
Original Mortgage
$417,000
Interest Rate
6.4%
Mortgage Type
Purchase Money Mortgage
Purchase Details
Closed on
Mar 16, 2006
Sold by
Vladimir John Palicka As Successor Trust and Vladimir Palicka
Bought by
Palicka Vladimir John
Purchase Details
Closed on
May 31, 2001
Sold by
Palick Vladimir and Palicka Zdenka
Bought by
Palicka Vladimir and Palicka Zdenka
Create a Home Valuation Report for This Property
The Home Valuation Report is an in-depth analysis detailing your home's value as well as a comparison with similar homes in the area
Home Values in the Area
Average Home Value in this Area
Purchase History
| Date | Buyer | Sale Price | Title Company |
|---|---|---|---|
| Karl Wong Revocable Living Trust | -- | -- | |
| Karl Wong Revocable Living Trust | -- | -- | |
| Karl Wong Revocable Living Trust | -- | -- | |
| Wong Karl | $987,702 | -- | |
| Wong Karl | $987,702 | -- | |
| Palicka Vladimir John | -- | -- | |
| Palicka Vladimir John | -- | -- | |
| Palicka Vladimir | -- | -- | |
| Palicka Vladimir | -- | -- |
Source: Public Records
Mortgage History
| Date | Status | Borrower | Loan Amount |
|---|---|---|---|
| Previous Owner | Wong Karl | $417,000 |
Source: Public Records
Tax History Compared to Growth
Tax History
| Year | Tax Paid | Tax Assessment Tax Assessment Total Assessment is a certain percentage of the fair market value that is determined by local assessors to be the total taxable value of land and additions on the property. | Land | Improvement |
|---|---|---|---|---|
| 2025 | $6,869 | $72,504 | $20,647 | $51,857 |
| 2024 | $6,869 | $68,400 | $23,674 | $44,726 |
| 2023 | $6,577 | $65,491 | $19,749 | $45,742 |
| 2022 | $6,312 | $64,500 | $23,340 | $41,160 |
| 2021 | $13,309 | $65,940 | $23,340 | $42,600 |
| 2020 | $12,972 | $70,500 | $23,340 | $47,160 |
| 2019 | $12,095 | $70,500 | $23,340 | $47,160 |
| 2018 | $11,125 | $54,576 | $19,991 | $34,585 |
| 2017 | $10,743 | $52,700 | $22,982 | $29,718 |
| 2016 | $10,535 | $52,700 | $22,982 | $29,718 |
| 2015 | $5,996 | $51,070 | $25,301 | $25,769 |
| 2014 | $5,996 | $48,180 | $25,920 | $22,260 |
Source: Public Records
Map
Nearby Homes
- 6967 181st St
- 182-14 69th Ave
- 18108 69th Ave
- 183-19 69th Ave
- 73-08 187th St
- 6954 180th St
- 7318 180th St
- 6740 182nd St
- 75-22 186th St
- 6737 180th St
- 7516 180th St
- 75-56 184th St
- 67 182nd St
- 73-50 190th St
- 65-15 183rd St
- 75-84 180th St
- 75-82 177 Street 177th St
- 18547 80th Rd
- 8012 188th St
- 8046 Chevy Chase St