6974 Ellingham Cir Unit F Alexandria, VA 22315
Estimated Value: $434,000 - $475,000
2
Beds
3
Baths
1,415
Sq Ft
$319/Sq Ft
Est. Value
About This Home
This home is located at 6974 Ellingham Cir Unit F, Alexandria, VA 22315 and is currently estimated at $451,799, approximately $319 per square foot. 6974 Ellingham Cir Unit F is a home located in Fairfax County with nearby schools including Hayfield Elementary School, Hayfield Secondary School, and Calvary Road Christian School & Preschool.
Ownership History
Date
Name
Owned For
Owner Type
Purchase Details
Closed on
Sep 18, 2023
Sold by
Urquieta Marilynn P
Bought by
Soliman Hanna M
Current Estimated Value
Home Financials for this Owner
Home Financials are based on the most recent Mortgage that was taken out on this home.
Original Mortgage
$417,100
Outstanding Balance
$408,467
Interest Rate
7.09%
Mortgage Type
New Conventional
Estimated Equity
$43,332
Purchase Details
Closed on
Nov 27, 2018
Sold by
Zani Denisa
Bought by
Urquieia Marilynn P
Home Financials for this Owner
Home Financials are based on the most recent Mortgage that was taken out on this home.
Original Mortgage
$217,600
Interest Rate
4.8%
Mortgage Type
New Conventional
Purchase Details
Closed on
Dec 28, 2017
Sold by
Mokulis Paula
Bought by
Zani Denisa
Create a Home Valuation Report for This Property
The Home Valuation Report is an in-depth analysis detailing your home's value as well as a comparison with similar homes in the area
Home Values in the Area
Average Home Value in this Area
Purchase History
| Date | Buyer | Sale Price | Title Company |
|---|---|---|---|
| Soliman Hanna M | $430,000 | Stewart Title Guaranty Company | |
| Urquieia Marilynn P | $272,000 | Provident Title & Escrow Llc | |
| Zani Denisa | $250,000 | Multiple |
Source: Public Records
Mortgage History
| Date | Status | Borrower | Loan Amount |
|---|---|---|---|
| Open | Soliman Hanna M | $417,100 | |
| Previous Owner | Urquieia Marilynn P | $217,600 |
Source: Public Records
Tax History Compared to Growth
Tax History
| Year | Tax Paid | Tax Assessment Tax Assessment Total Assessment is a certain percentage of the fair market value that is determined by local assessors to be the total taxable value of land and additions on the property. | Land | Improvement |
|---|---|---|---|---|
| 2025 | $4,905 | $440,340 | $88,000 | $352,340 |
| 2024 | $4,905 | $423,400 | $85,000 | $338,400 |
| 2023 | $4,508 | $399,430 | $80,000 | $319,430 |
| 2022 | $4,309 | $376,820 | $75,000 | $301,820 |
| 2021 | $3,948 | $336,450 | $67,000 | $269,450 |
| 2020 | $3,810 | $321,960 | $64,000 | $257,960 |
| 2019 | $3,563 | $301,080 | $60,000 | $241,080 |
| 2018 | $3,643 | $316,770 | $63,000 | $253,770 |
| 2017 | $3,503 | $301,690 | $60,000 | $241,690 |
| 2016 | $3,391 | $292,680 | $59,000 | $233,680 |
| 2015 | $3,202 | $286,940 | $57,000 | $229,940 |
| 2014 | $3,074 | $276,100 | $55,000 | $221,100 |
Source: Public Records
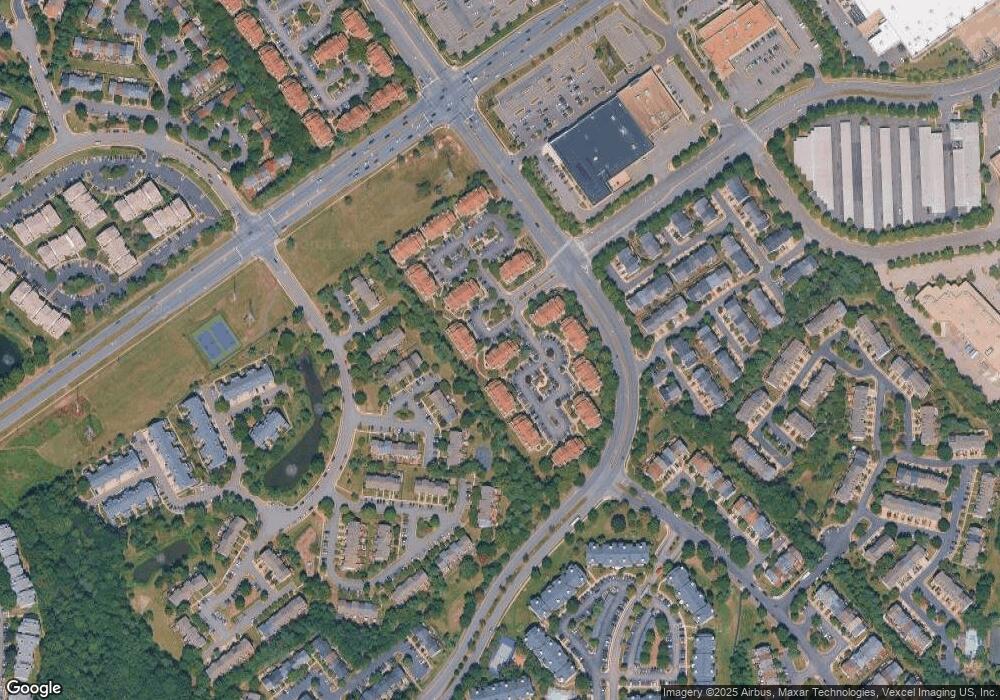
Map
Nearby Homes
- 6964 Ellingham Cir Unit 86
- 6944 Ellingham Cir Unit A
- 6000 Ellesmere Ct Unit B
- 6864F Brindle Heath Way Unit 208
- 7039 Kings Manor Dr
- 7013 Birkenhead Place Unit F
- 7057 Kings Manor Dr
- 6925 Mary Caroline Cir Unit H
- 6902 Mary Caroline Cir Unit E
- 6905B Keyser Way
- 5321 Buxton Ct
- 6017F Curtier Dr Unit F
- 6017B Curtier Dr Unit B
- 7235 Worsley Way
- 6631 Dunwich Way
- 6122 Old Brentford Ct
- 6126 Old Brentford Ct
- 6620 Haltwhistle Ln
- 5905 Saint Giles Way
- 7010 Old Brentford Rd
- 6974 Ellingham Cir Unit 78
- 6974 Ellingham Cir
- 6974 Ellingham Cir Unit 74
- 6974 Ellingham Cir Unit 73
- 6974 Ellingham Cir Unit 75
- 6974 Ellingham Cir Unit 76
- 6974 Ellingham Cir Unit D
- 6974 UNIT-A Ellingham Cir Unit 73-A
- 6974 Ellingham Cir Unit 77
- 6974 Ellingham Cir Unit E
- 6974 Ellingham Circle F Unit 78
- 6976 Ellingham Cir Unit 79
- 6974B Ellingham Cir Unit 74
- 6974-B Ellingham Cir
- 6976 Ellingham Cir
- 6974 Ellingham Circle B Unit 74
- 6974 Ellingham Circle D Unit 76
- 6970 Ellingham Cir Unit 71
- 6972 Ellingham Cir Unit 72
- 6972 Ellingham Cir