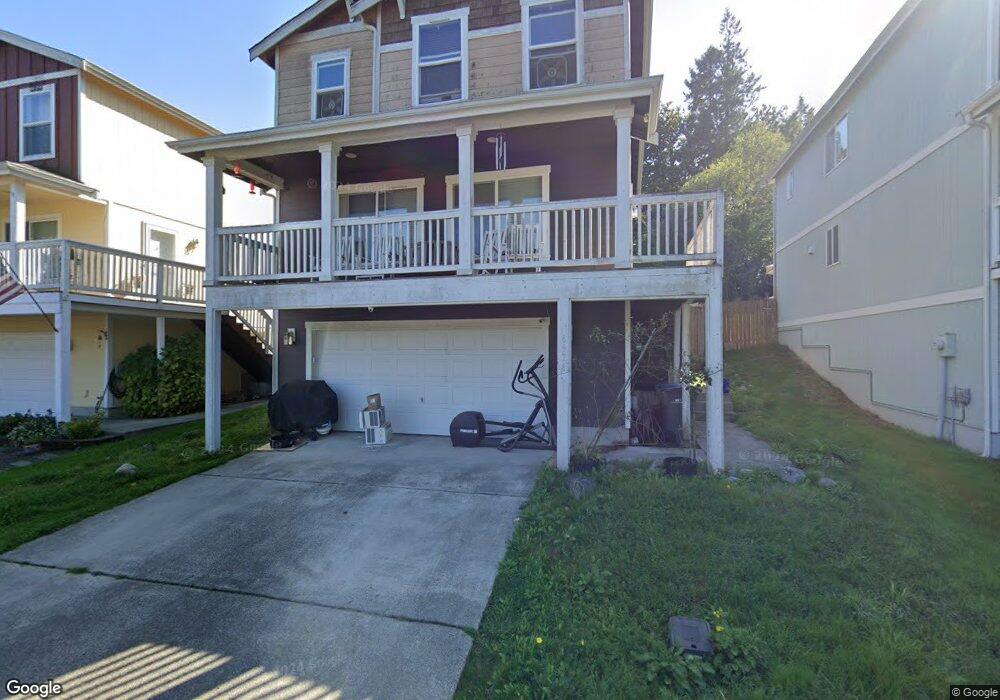
6976 E Dakota St Port Orchard, WA 98366
Manchester NeighborhoodEstimated Value: $489,994 - $557,000
3
Beds
3
Baths
1,854
Sq Ft
$278/Sq Ft
Est. Value
About This Home
This home is located at 6976 E Dakota St, Port Orchard, WA 98366 and is currently estimated at $515,999, approximately $278 per square foot. 6976 E Dakota St is a home located in Kitsap County with nearby schools including Manchester Elementary School, John Sedgwick Middle School, and South Kitsap High School.
Ownership History
Date
Name
Owned For
Owner Type
Purchase Details
Closed on
Mar 7, 2006
Sold by
Harbor Development & Construction Llc
Bought by
Kloiber Daniel A and Kloiber Jennifer B
Current Estimated Value
Home Financials for this Owner
Home Financials are based on the most recent Mortgage that was taken out on this home.
Original Mortgage
$220,000
Outstanding Balance
$124,408
Interest Rate
6.18%
Mortgage Type
Fannie Mae Freddie Mac
Estimated Equity
$391,591
Purchase Details
Closed on
Aug 24, 2004
Sold by
Jacobsen Richard E and Jacobsen Edna
Bought by
Harbor Development & Construction Llc
Home Financials for this Owner
Home Financials are based on the most recent Mortgage that was taken out on this home.
Original Mortgage
$45,000
Interest Rate
5.92%
Mortgage Type
Purchase Money Mortgage
Create a Home Valuation Report for This Property
The Home Valuation Report is an in-depth analysis detailing your home's value as well as a comparison with similar homes in the area
Home Values in the Area
Average Home Value in this Area
Purchase History
| Date | Buyer | Sale Price | Title Company |
|---|---|---|---|
| Kloiber Daniel A | $260,180 | Pacific Nw Title | |
| Harbor Development & Construction Llc | $50,000 | Transnation Title |
Source: Public Records
Mortgage History
| Date | Status | Borrower | Loan Amount |
|---|---|---|---|
| Open | Kloiber Daniel A | $220,000 | |
| Previous Owner | Harbor Development & Construction Llc | $45,000 |
Source: Public Records
Tax History Compared to Growth
Tax History
| Year | Tax Paid | Tax Assessment Tax Assessment Total Assessment is a certain percentage of the fair market value that is determined by local assessors to be the total taxable value of land and additions on the property. | Land | Improvement |
|---|---|---|---|---|
| 2026 | $3,596 | $412,080 | $79,310 | $332,770 |
| 2025 | $3,596 | $412,080 | $79,310 | $332,770 |
| 2024 | $3,487 | $412,080 | $79,310 | $332,770 |
| 2023 | $3,461 | $412,080 | $79,310 | $332,770 |
| 2022 | $3,320 | $330,790 | $63,570 | $267,220 |
| 2021 | $3,173 | $299,190 | $60,540 | $238,650 |
| 2020 | $3,123 | $286,330 | $54,740 | $231,590 |
| 2019 | $2,690 | $271,080 | $51,620 | $219,460 |
| 2018 | $2,927 | $222,860 | $46,730 | $176,130 |
| 2017 | $2,435 | $222,860 | $46,730 | $176,130 |
| 2016 | $2,537 | $212,970 | $44,500 | $168,470 |
| 2015 | $2,327 | $197,660 | $44,500 | $153,160 |
| 2014 | -- | $186,220 | $43,760 | $142,460 |
| 2013 | -- | $186,220 | $43,760 | $142,460 |
Source: Public Records
Map
Nearby Homes
- 7000 E Dakota St
- 7006 E Dakota St
- 7041 E Washington St
- 7260 E Last Refuge Way
- 6997 E Bullseye St
- 7057 E Bullseye St
- 7081 E Bullseye St
- 7016 E Nightingale St
- 7020 E Nightingale St
- 7058 E Nightingale St
- 3200 Nevada East Ave
- 22 Lots Ave
- 0 Nevada Ave & Michigan St Unit NWM2365944
- 7548 E Grandview St
- 7590 E Idaho St
- 7579 E Idaho St
- 6754 Missouri St E
- 7569 E Montana St
- 2585 Alaska Ave E
- 2440 Alaska Ave E
- 6988 E Dakota St
- 6964 E Dakota St
- 6994 E Dakota St
- 0 E Wyoming St Unit NWM2003070
- 0 E Wyoming St
- 0 Dakota St Unit 2003087
- 6989 E Dakota St
- 6958 E Dakota St
- 6995 E Dakota St
- 7016 E Washington St
- 7023 Washington Ave SE
- 7028 E Washington St
- 7023 E Washington St
- 2800 Nevada Ave E
- 6948 E Wyoming St
- 2788 Nevada Ave E
- 2824 Nevada Ave E
- 6960 E Wyoming St
- 6967 Washington Ave SE