6977 Miro Ct Niwot, CO 80503
Niwot NeighborhoodEstimated Value: $551,285 - $676,000
2
Beds
2
Baths
1,076
Sq Ft
$574/Sq Ft
Est. Value
About This Home
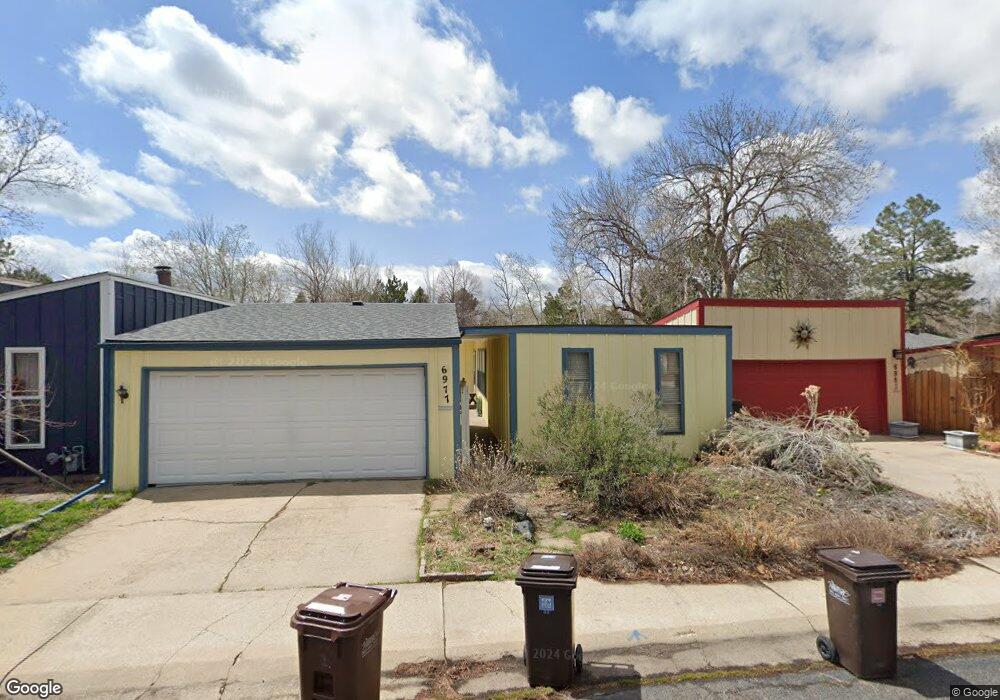
This home is located at 6977 Miro Ct, Niwot, CO 80503 and is currently estimated at $617,821, approximately $574 per square foot. 6977 Miro Ct is a home located in Boulder County with nearby schools including Niwot Elementary School, Sunset Middle School, and Niwot High School.
Ownership History
Date
Name
Owned For
Owner Type
Purchase Details
Closed on
May 25, 2001
Sold by
Koeniger Gloria J
Bought by
Horne Susan H
Current Estimated Value
Home Financials for this Owner
Home Financials are based on the most recent Mortgage that was taken out on this home.
Original Mortgage
$159,500
Outstanding Balance
$59,733
Interest Rate
7.07%
Estimated Equity
$558,088
Purchase Details
Closed on
Dec 27, 1999
Sold by
Winwood Jeffrey A
Bought by
Koeniger Gloria J
Purchase Details
Closed on
Mar 20, 1998
Sold by
Thompson Mitzi A
Bought by
Winwood Jeffrey A and Koeniger Gloria J
Purchase Details
Closed on
Mar 3, 1997
Sold by
Fellows Richard D
Bought by
Thompson Mitzi A
Purchase Details
Closed on
Jan 19, 1996
Sold by
Allen Bettie A
Bought by
Thompson Mitzi A
Home Financials for this Owner
Home Financials are based on the most recent Mortgage that was taken out on this home.
Original Mortgage
$97,200
Interest Rate
7.14%
Create a Home Valuation Report for This Property
The Home Valuation Report is an in-depth analysis detailing your home's value as well as a comparison with similar homes in the area
Home Values in the Area
Average Home Value in this Area
Purchase History
| Date | Buyer | Sale Price | Title Company |
|---|---|---|---|
| Horne Susan H | $213,500 | -- | |
| Koeniger Gloria J | -- | -- | |
| Winwood Jeffrey A | $128,500 | -- | |
| Thompson Mitzi A | -- | -- | |
| Thompson Mitzi A | $108,000 | -- |
Source: Public Records
Mortgage History
| Date | Status | Borrower | Loan Amount |
|---|---|---|---|
| Open | Horne Susan H | $159,500 | |
| Previous Owner | Thompson Mitzi A | $97,200 | |
| Closed | Horne Susan H | $25,000 |
Source: Public Records
Tax History Compared to Growth
Tax History
| Year | Tax Paid | Tax Assessment Tax Assessment Total Assessment is a certain percentage of the fair market value that is determined by local assessors to be the total taxable value of land and additions on the property. | Land | Improvement |
|---|---|---|---|---|
| 2025 | $2,656 | $34,356 | $10,656 | $23,700 |
| 2024 | $2,656 | $34,356 | $10,656 | $23,700 |
| 2023 | $2,621 | $33,333 | $9,869 | $27,148 |
| 2022 | $2,118 | $27,439 | $8,896 | $18,543 |
| 2021 | $2,146 | $28,228 | $9,152 | $19,076 |
| 2020 | $2,001 | $26,834 | $3,718 | $23,116 |
| 2019 | $1,968 | $26,834 | $3,718 | $23,116 |
| 2018 | $1,511 | $22,342 | $3,456 | $18,886 |
| 2017 | $1,423 | $24,700 | $3,821 | $20,879 |
| 2016 | $2,305 | $24,215 | $4,856 | $19,359 |
| 2015 | $2,196 | $18,228 | $4,696 | $13,532 |
| 2014 | $1,899 | $18,228 | $4,696 | $13,532 |
Source: Public Records
Map
Nearby Homes
- 8050 Niwot Rd Unit 1
- 8050 Niwot Rd Unit 28
- 8050 Niwot Rd Unit 40
- 8060 Niwot Rd Unit 66E
- 8060 Niwot Rd Unit 34
- 8076 Meadowdale Square
- 8180 Dry Creek Cir
- 7464 Whirlaway Ln
- 7284 Dry Creek Rd
- 8400 Sawtooth Ln
- 8461 Pawnee Ln
- 3625 Nimbus Rd
- 8748 Skyland Dr
- 7204 Spring Creek Cir
- 6789 Niwot Rd
- 8896 Niwot Rd
- 8020 N 81st St
- 6541 Legend Ridge Trail
- 7466 Park Lane Rd
- 6557 Legend Ridge Trail
- 6973 Miro Ct
- 6983 Miro Ct
- 6967 Miro Ct
- 6980 Niwot Square
- 6987 Miro Ct
- 6960 Niwot Square
- 6990 Niwot Square
- 6993 Miro Ct
- 6952 Totara Place
- 6992 Miro Ct
- 6946 Totara Place
- 6947 Totara Place
- 6953 Totara Place
- 6982 Miro Ct
- 6943 Totara Place
- 6962 Miro Ct
- 7808 Nikau Dr
- 6957 Totara Place
- 6942 Totara Place
- 6972 Miro Ct