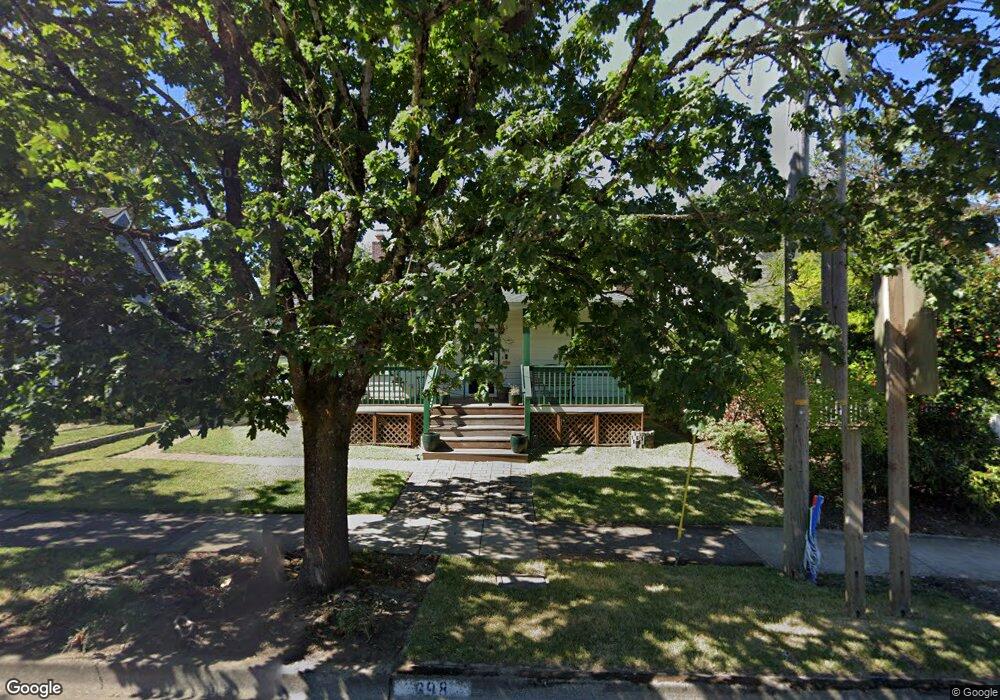
698 NW 2nd St Corvallis, OR 97330
Northwest Corvallis NeighborhoodEstimated Value: $464,000 - $633,000
4
Beds
2
Baths
1,162
Sq Ft
$452/Sq Ft
Est. Value
About This Home
This home is located at 698 NW 2nd St, Corvallis, OR 97330 and is currently estimated at $524,793, approximately $451 per square foot. 698 NW 2nd St is a home located in Benton County with nearby schools including Garfield Elementary School, Linus Pauling Middle School, and Corvallis High School.
Ownership History
Date
Name
Owned For
Owner Type
Purchase Details
Closed on
Jun 4, 2010
Sold by
Dapp Kari E
Bought by
Phelps Linda C
Current Estimated Value
Home Financials for this Owner
Home Financials are based on the most recent Mortgage that was taken out on this home.
Original Mortgage
$139,320
Outstanding Balance
$93,021
Interest Rate
5.05%
Mortgage Type
New Conventional
Estimated Equity
$431,772
Purchase Details
Closed on
Apr 23, 2010
Sold by
Boire M T
Bought by
Dapp Kari E
Home Financials for this Owner
Home Financials are based on the most recent Mortgage that was taken out on this home.
Original Mortgage
$139,320
Outstanding Balance
$93,021
Interest Rate
5.05%
Mortgage Type
New Conventional
Estimated Equity
$431,772
Purchase Details
Closed on
Sep 17, 2003
Sold by
Bennett Francis W
Bought by
Dapp Kari E and Dapp Boire M
Home Financials for this Owner
Home Financials are based on the most recent Mortgage that was taken out on this home.
Original Mortgage
$121,365
Interest Rate
6.3%
Mortgage Type
Purchase Money Mortgage
Create a Home Valuation Report for This Property
The Home Valuation Report is an in-depth analysis detailing your home's value as well as a comparison with similar homes in the area
Home Values in the Area
Average Home Value in this Area
Purchase History
| Date | Buyer | Sale Price | Title Company |
|---|---|---|---|
| Phelps Linda C | $174,150 | Ticor Title | |
| Dapp Kari E | $25,000 | Accommodation | |
| Dapp Kari E | $135,000 | Amerititle |
Source: Public Records
Mortgage History
| Date | Status | Borrower | Loan Amount |
|---|---|---|---|
| Open | Phelps Linda C | $139,320 | |
| Previous Owner | Dapp Kari E | $121,365 |
Source: Public Records
Tax History Compared to Growth
Tax History
| Year | Tax Paid | Tax Assessment Tax Assessment Total Assessment is a certain percentage of the fair market value that is determined by local assessors to be the total taxable value of land and additions on the property. | Land | Improvement |
|---|---|---|---|---|
| 2025 | $3,058 | $163,968 | -- | -- |
| 2024 | $3,058 | $159,192 | -- | -- |
| 2023 | $2,879 | $154,555 | $0 | $0 |
| 2022 | $2,795 | $150,053 | $0 | $0 |
| 2021 | $2,703 | $145,683 | $0 | $0 |
| 2020 | $2,688 | $141,440 | $0 | $0 |
| 2019 | $2,478 | $137,320 | $0 | $0 |
| 2018 | $2,491 | $133,320 | $0 | $0 |
| 2017 | $2,304 | $129,437 | $0 | $0 |
| 2016 | $2,294 | $125,667 | $0 | $0 |
| 2015 | $2,246 | $122,007 | $0 | $0 |
| 2014 | $2,188 | $118,453 | $0 | $0 |
| 2012 | -- | $111,653 | $0 | $0 |
Source: Public Records
Map
Nearby Homes
- 0 Oregon 99w Unit 810040
- 426 NW 11th St
- 300 SW 2nd St
- 1100 NW Dixon St
- 340 SW 5th St
- 430 SW 6th St
- 223 NW 15th St
- 1230 NW 13th St
- 1225 NW 18th St
- 620 NW 19th St
- 1430 NW 15th St
- 1003 SW 10th St
- 1825 NW Grant Ave
- 1720 NW Division St
- 3753 NW Goldfinch Dr
- 3913 NW Goldfinch Dr
- 3723 NW Goldfinch Dr
- 3933 NW Goldfinch Dr
- 3700 NW Goldfinch Dr
- 3733 NW Goldfinch Dr