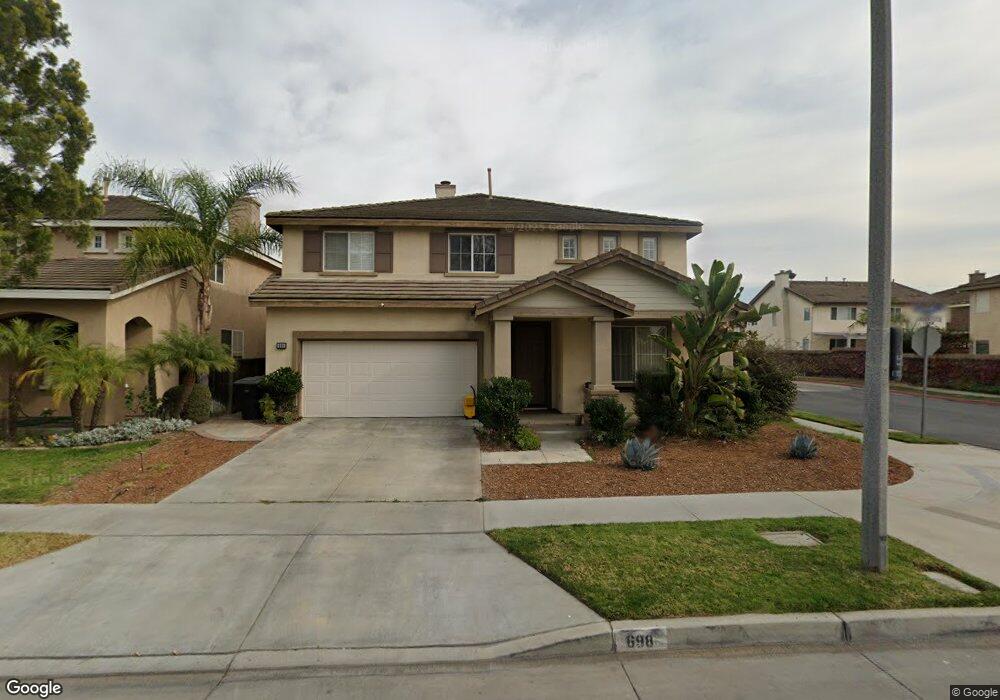
698 S Halliday St Anaheim, CA 92804
West Anaheim NeighborhoodEstimated Value: $1,196,430 - $1,455,000
5
Beds
3
Baths
2,858
Sq Ft
$450/Sq Ft
Est. Value
About This Home
This home is located at 698 S Halliday St, Anaheim, CA 92804 and is currently estimated at $1,286,608, approximately $450 per square foot. 698 S Halliday St is a home located in Orange County with nearby schools including Twila Reid Elementary, Orangeview Junior High, and Western High School.
Ownership History
Date
Name
Owned For
Owner Type
Purchase Details
Closed on
Sep 13, 2018
Sold by
Nguyen Thang Nhut and Chan Bich Thi
Bought by
Nguyen Thang Nhut and Chan Bich Thi
Current Estimated Value
Home Financials for this Owner
Home Financials are based on the most recent Mortgage that was taken out on this home.
Original Mortgage
$200,000
Interest Rate
4.5%
Mortgage Type
New Conventional
Purchase Details
Closed on
Oct 11, 2010
Sold by
Nguyen Thang Nhut and Chau Bich Thi
Bought by
Nguyen Thang Nhut and Chau Bich Thi
Home Financials for this Owner
Home Financials are based on the most recent Mortgage that was taken out on this home.
Original Mortgage
$163,000
Interest Rate
4.26%
Mortgage Type
New Conventional
Purchase Details
Closed on
Apr 19, 2006
Sold by
Nguyen Thang Nhut and Chau Bich Thi
Bought by
Nguyen Thang Nhut and Chau Bich Thi
Home Financials for this Owner
Home Financials are based on the most recent Mortgage that was taken out on this home.
Original Mortgage
$330,000
Interest Rate
6.35%
Mortgage Type
Fannie Mae Freddie Mac
Purchase Details
Closed on
Jan 5, 2006
Sold by
Nguyen Thang Nhut and Chau Bich Thi
Bought by
Nguyen Thang Nhut and Chau Bich Thi
Home Financials for this Owner
Home Financials are based on the most recent Mortgage that was taken out on this home.
Original Mortgage
$400,000
Interest Rate
6.25%
Mortgage Type
Credit Line Revolving
Purchase Details
Closed on
Dec 6, 2005
Sold by
Nguyen Thang Nhut and Chau Bich Thi
Bought by
Nguyen Thang Nhut and Chau Bich Thi
Home Financials for this Owner
Home Financials are based on the most recent Mortgage that was taken out on this home.
Original Mortgage
$400,000
Interest Rate
6.25%
Mortgage Type
Credit Line Revolving
Purchase Details
Closed on
Sep 5, 2002
Sold by
Nguyen Thang Nhut and Chau Bich Thi
Bought by
Nguyen Thang Nhut and Chau Bich Thi
Purchase Details
Closed on
Jun 30, 2000
Sold by
Nguyen Thang Nhut
Bought by
Nguyen Thang Nhut and Chau Bich Thi
Purchase Details
Closed on
May 1, 2000
Sold by
Chau Bich Thi
Bought by
Nguyen Thang Nhut
Purchase Details
Closed on
Feb 28, 2000
Sold by
Greystone Homes Inc
Bought by
Nguyen Thang Nhut
Home Financials for this Owner
Home Financials are based on the most recent Mortgage that was taken out on this home.
Original Mortgage
$252,700
Interest Rate
8.22%
Create a Home Valuation Report for This Property
The Home Valuation Report is an in-depth analysis detailing your home's value as well as a comparison with similar homes in the area
Home Values in the Area
Average Home Value in this Area
Purchase History
| Date | Buyer | Sale Price | Title Company |
|---|---|---|---|
| Nguyen Thang Nhut | -- | Provident Title Co | |
| Nguyen Thang Nhut | -- | None Available | |
| Nguyen Thang Nhut | -- | Lsi | |
| Nguyen Thang Nhut | -- | Old Republic Title Co O C | |
| Nguyen Thang Nhut | -- | Old Republic Title Co O C | |
| Nguyen Thang Nhut | -- | Commonwealth Land Title Co | |
| Nguyen Thang Nhut | -- | Commonwealth Land Title Co | |
| Nguyen Thang Nhut | -- | Commonwealth Land Title Co | |
| Nguyen Thang Ngut | -- | Commonwealth Land Title Co | |
| Nguyen Thang Nhut | -- | -- | |
| Nguyen Thang Nhut | -- | -- | |
| Nguyen Thang Nhut | -- | North American Title Co | |
| Nguyen Thang Nhut | $369,000 | North American Title Co |
Source: Public Records
Mortgage History
| Date | Status | Borrower | Loan Amount |
|---|---|---|---|
| Previous Owner | Nguyen Thang Nhut | $200,000 | |
| Previous Owner | Nguyen Thang Nhut | $163,000 | |
| Previous Owner | Nguyen Thang Nhut | $330,000 | |
| Previous Owner | Nguyen Thang Nhut | $400,000 | |
| Previous Owner | Nguyen Thang Ngut | $90,000 | |
| Previous Owner | Nguyen Thang Nhut | $252,700 |
Source: Public Records
Tax History Compared to Growth
Tax History
| Year | Tax Paid | Tax Assessment Tax Assessment Total Assessment is a certain percentage of the fair market value that is determined by local assessors to be the total taxable value of land and additions on the property. | Land | Improvement |
|---|---|---|---|---|
| 2025 | $6,501 | $566,659 | $213,258 | $353,401 |
| 2024 | $6,501 | $555,549 | $209,077 | $346,472 |
| 2023 | $6,334 | $544,656 | $204,977 | $339,679 |
| 2022 | $6,209 | $533,977 | $200,958 | $333,019 |
| 2021 | $6,269 | $523,507 | $197,017 | $326,490 |
| 2020 | $6,184 | $518,140 | $194,997 | $323,143 |
| 2019 | $6,011 | $507,981 | $191,174 | $316,807 |
| 2018 | $5,926 | $498,021 | $187,425 | $310,596 |
| 2017 | $5,719 | $488,256 | $183,750 | $304,506 |
| 2016 | $5,695 | $478,683 | $180,147 | $298,536 |
| 2015 | $5,634 | $471,493 | $177,441 | $294,052 |
| 2014 | $5,344 | $462,258 | $173,966 | $288,292 |
Source: Public Records
Map
Nearby Homes
- 612 S Halliday St
- 716 S Hayward St Unit 2
- 3115 W Teranimar Dr
- 235 S Beach Blvd Unit 132
- 900 S Hayward St
- 2945 W Bridgeport Ave
- 211 S Beach Blvd Unit 92
- 2942 W Floyd Ave
- 1203 S Courtright St
- 3050 W Ball Rd Unit 115B
- 3050 W Ball Rd Unit 88
- 3050 W Ball Rd Unit 127
- 3050 W Ball Rd Unit 132
- 3050 W Ball Rd Unit 152
- 3050 W Ball Rd Unit 82
- 3050 W Ball Rd Unit 171
- 3050 W Ball Rd Unit 200
- 3300 W Orange Ave
- 103 S Laxore St
- 106 S Laxore St Unit 407
- 690 S Halliday St
- 691 S Lassen Ct
- 683 S Lassen Ct
- 682 S Halliday St
- 706 S Halliday St
- 675 S Lassen Ct
- 715 S Lassen Ct
- 674 S Halliday St
- 714 S Halliday St
- 667 S Lassen Ct
- 723 S Lassen Ct
- 668 S Halliday St
- 696 S Lassen Ct
- 722 S Halliday St
- 659 S Lassen Ct
- 688 S Lassen Ct
- 704 S Lassen Ct Unit 1
- 704 S Lassen Ct
- 731 S Lassen Ct
- 680 S Lassen Ct