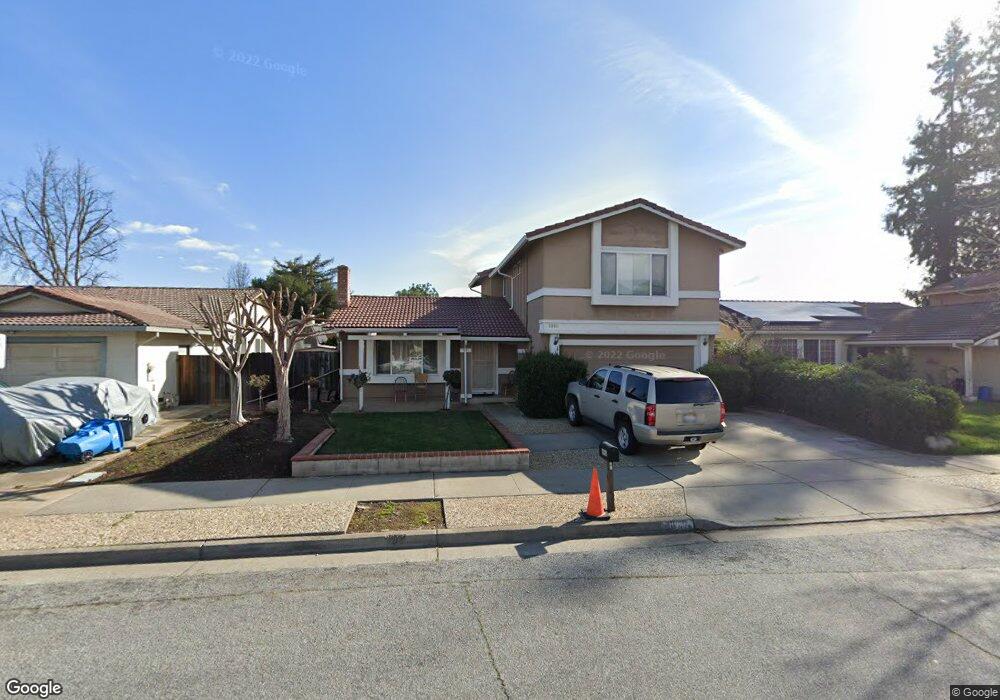
6980 Glenview Dr Gilroy, CA 95020
Estimated Value: $802,000 - $994,000
4
Beds
3
Baths
1,588
Sq Ft
$559/Sq Ft
Est. Value
About This Home
This home is located at 6980 Glenview Dr, Gilroy, CA 95020 and is currently estimated at $888,415, approximately $559 per square foot. 6980 Glenview Dr is a home located in Santa Clara County with nearby schools including Glen View Elementary School, Solorsano Middle School, and Gilroy High School.
Ownership History
Date
Name
Owned For
Owner Type
Purchase Details
Closed on
Jul 26, 2004
Sold by
Flores Francisco R and Flores Francisco Ruiz
Bought by
Flores Francisco R and Flores Gema Torres
Current Estimated Value
Home Financials for this Owner
Home Financials are based on the most recent Mortgage that was taken out on this home.
Original Mortgage
$372,000
Outstanding Balance
$172,115
Interest Rate
5%
Mortgage Type
New Conventional
Estimated Equity
$716,300
Purchase Details
Closed on
Oct 26, 2001
Sold by
Miller Eugene R and Miller Kathleen A
Bought by
Flores Francisco Ruiz
Home Financials for this Owner
Home Financials are based on the most recent Mortgage that was taken out on this home.
Original Mortgage
$295,200
Interest Rate
6.62%
Create a Home Valuation Report for This Property
The Home Valuation Report is an in-depth analysis detailing your home's value as well as a comparison with similar homes in the area
Home Values in the Area
Average Home Value in this Area
Purchase History
| Date | Buyer | Sale Price | Title Company |
|---|---|---|---|
| Flores Francisco R | -- | Alliance Title Company | |
| Flores Francisco Ruiz | $369,000 | Chicago Title Co |
Source: Public Records
Mortgage History
| Date | Status | Borrower | Loan Amount |
|---|---|---|---|
| Open | Flores Francisco R | $372,000 | |
| Closed | Flores Francisco Ruiz | $295,200 | |
| Closed | Flores Francisco Ruiz | $36,900 | |
| Closed | Flores Francisco R | $25,000 |
Source: Public Records
Tax History
| Year | Tax Paid | Tax Assessment Tax Assessment Total Assessment is a certain percentage of the fair market value that is determined by local assessors to be the total taxable value of land and additions on the property. | Land | Improvement |
|---|---|---|---|---|
| 2025 | $6,592 | $545,101 | $299,733 | $245,368 |
| 2024 | $6,592 | $534,413 | $293,856 | $240,557 |
| 2023 | $6,551 | $523,936 | $288,095 | $235,841 |
| 2022 | $6,442 | $513,664 | $282,447 | $231,217 |
| 2021 | $6,411 | $503,593 | $276,909 | $226,684 |
| 2020 | $6,340 | $498,430 | $274,070 | $224,360 |
| 2019 | $6,280 | $488,658 | $268,697 | $219,961 |
| 2018 | $5,864 | $479,078 | $263,429 | $215,649 |
| 2017 | $5,985 | $469,685 | $258,264 | $211,421 |
| 2016 | $5,862 | $460,476 | $253,200 | $207,276 |
| 2015 | $5,530 | $453,560 | $249,397 | $204,163 |
| 2014 | $5,494 | $444,676 | $244,512 | $200,164 |
Source: Public Records
Map
Nearby Homes
- 500 W 10th St Unit 177
- 6735 Stephan Ct
- 750 W 9th St
- 7051 Eigleberry St
- 6595 Princevalle St
- 6565 Princevalle St
- 319 Churchill Place
- 45 Angra Way
- 7191 Eigleberry St
- 7310 Carmel St
- Plan 2 at Heritage on 6th Street
- Plan 1 at Heritage on 6th Street
- 7351 Princevalle St Unit Homesite 18
- 7360 Ailes Ct
- 7100 Potomac Place
- 7376 Ailes Ct
- 7384 Ailes Ct
- 751 W 6th St
- 131 Lusitano Way
- 125 Lusitano Way
- 6970 Glenview Dr
- 6990 Glenview Dr
- 6960 Glenview Dr
- 6985 Glenview Dr
- 6995 Glenview Dr
- 6975 Glenview Dr
- 6950 Glenview Dr
- 541 W 10th St
- 6940 Glenview Dr
- 615 Blossom Glen Ct
- 571 W 10th St
- 521 W 10th St
- 6955 Glenview Dr
- 591 W 10th St
- 511 W 10th St
- 500 W 10th St Unit 79
- 500 W 10th St Unit 91
- 500 W 10th St Unit 125
- 500 W 10th St Unit 58
- 500 W 10th St Unit 145
Your Personal Tour Guide
Ask me questions while you tour the home.