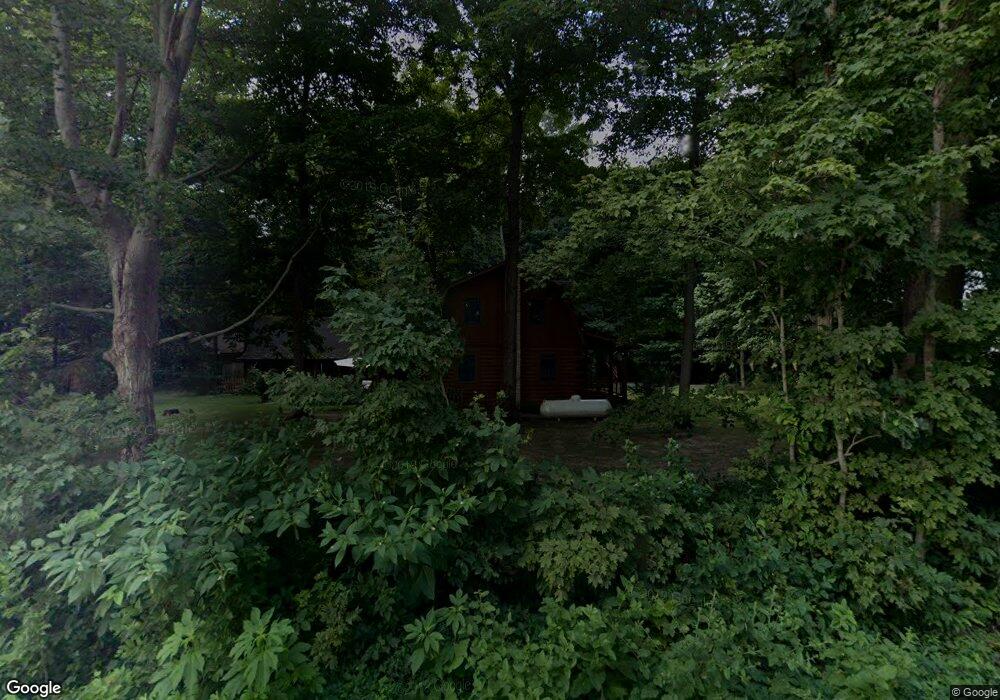
6980 Morris Rd Springfield, OH 45502
Estimated Value: $297,515 - $336,000
3
Beds
2
Baths
1,728
Sq Ft
$181/Sq Ft
Est. Value
About This Home
This home is located at 6980 Morris Rd, Springfield, OH 45502 and is currently estimated at $313,629, approximately $181 per square foot. 6980 Morris Rd is a home located in Clark County with nearby schools including Northridge Elementary School and Kenton Ridge Middle & High School.
Ownership History
Date
Name
Owned For
Owner Type
Purchase Details
Closed on
May 20, 2021
Sold by
Osborne Miranda Bethany and Osborne Jerrod Lee
Bought by
Osborne Miranda Bethany and Osborne Jerrod Lee
Current Estimated Value
Home Financials for this Owner
Home Financials are based on the most recent Mortgage that was taken out on this home.
Original Mortgage
$145,000
Outstanding Balance
$107,233
Interest Rate
2.93%
Mortgage Type
New Conventional
Estimated Equity
$206,396
Purchase Details
Closed on
Oct 31, 2013
Sold by
Barney Vernon D and Barney Cinda
Bought by
Naegele Miranda B
Home Financials for this Owner
Home Financials are based on the most recent Mortgage that was taken out on this home.
Original Mortgage
$165,205
Interest Rate
4.24%
Mortgage Type
New Conventional
Purchase Details
Closed on
Oct 11, 1988
Sold by
Russell Donald W and Russell Lila M
Bought by
Barney Vernon D and Barney Cinda
Purchase Details
Closed on
Jan 25, 1988
Create a Home Valuation Report for This Property
The Home Valuation Report is an in-depth analysis detailing your home's value as well as a comparison with similar homes in the area
Purchase History
| Date | Buyer | Sale Price | Title Company |
|---|---|---|---|
| Osborne Miranda Bethany | -- | Radian Settlement Svcs Inc | |
| Naegele Miranda B | $173,900 | Attorney | |
| Barney Vernon D | $18,500 | -- | |
| -- | $15,000 | -- |
Source: Public Records
Mortgage History
| Date | Status | Borrower | Loan Amount |
|---|---|---|---|
| Open | Osborne Miranda Bethany | $145,000 | |
| Closed | Naegele Miranda B | $165,205 |
Source: Public Records
Tax History
| Year | Tax Paid | Tax Assessment Tax Assessment Total Assessment is a certain percentage of the fair market value that is determined by local assessors to be the total taxable value of land and additions on the property. | Land | Improvement |
|---|---|---|---|---|
| 2025 | $2,955 | $80,840 | $20,070 | $60,770 |
| 2024 | $2,857 | $67,530 | $15,560 | $51,970 |
| 2023 | $2,857 | $67,530 | $15,560 | $51,970 |
| 2022 | $2,868 | $67,530 | $15,560 | $51,970 |
| 2021 | $2,800 | $55,880 | $12,760 | $43,120 |
| 2020 | $2,803 | $55,880 | $12,760 | $43,120 |
| 2019 | $2,856 | $55,880 | $12,760 | $43,120 |
| 2018 | $2,640 | $49,570 | $11,810 | $37,760 |
| 2017 | $2,262 | $49,571 | $11,813 | $37,758 |
| 2016 | $2,247 | $49,571 | $11,813 | $37,758 |
| 2015 | $2,184 | $46,414 | $11,813 | $34,601 |
| 2014 | $2,184 | $46,414 | $11,813 | $34,601 |
| 2013 | $1,731 | $46,414 | $11,813 | $34,601 |
Source: Public Records
Map
Nearby Homes
- 4273 Kay Ave
- 4954 E County Line Rd
- 4607 Plateau Dr S
- 5060 Morris Rd
- 4816 Middle Urbana Rd
- 1977 Willoughby Ave
- 4180 Briarwood Dr
- 4381 Briarwood Dr
- 1470 Oldham Dr Unit 12
- 1398 Elizabeth Ct Unit 66
- Tract 8 Middle Urbana Rd
- 4890 Brannan Dr W Unit 4890
- Tract 3 Middle Urbana Rd
- 937 Willow Rd
- 1521 Erika Dr
- 4500 Bosart Rd
- 5645 Springfield-Urbana Pike Unit Lot 67
- 4732 Lehigh Dr
- 5235 W Ridgewood Rd
- 1309 Richmoor Rd
- 6920 Morris Rd
- 3506 E County Line Rd
- 0 E County Line Rd
- 6900 Morris Rd
- 6890 Morris Rd
- 6800 Morris Rd
- 3724 E County Line Rd
- 6710 Morris Rd
- 3282 E County Line Rd
- 3525 Mumper Rd
- 3456 Sandalwood Ave
- 3428 Sandalwood Ave
- 3625 Mumper Rd
- 3625 Mumper Rd
- 3617 Mumper Rd
- 3601 Mumper Rd
- 3647 Mumper Rd
- 3695 Mumper Rd
- 3480 Sandalwood Ave
- 3671 Mumper Rd
Your Personal Tour Guide
Ask me questions while you tour the home.