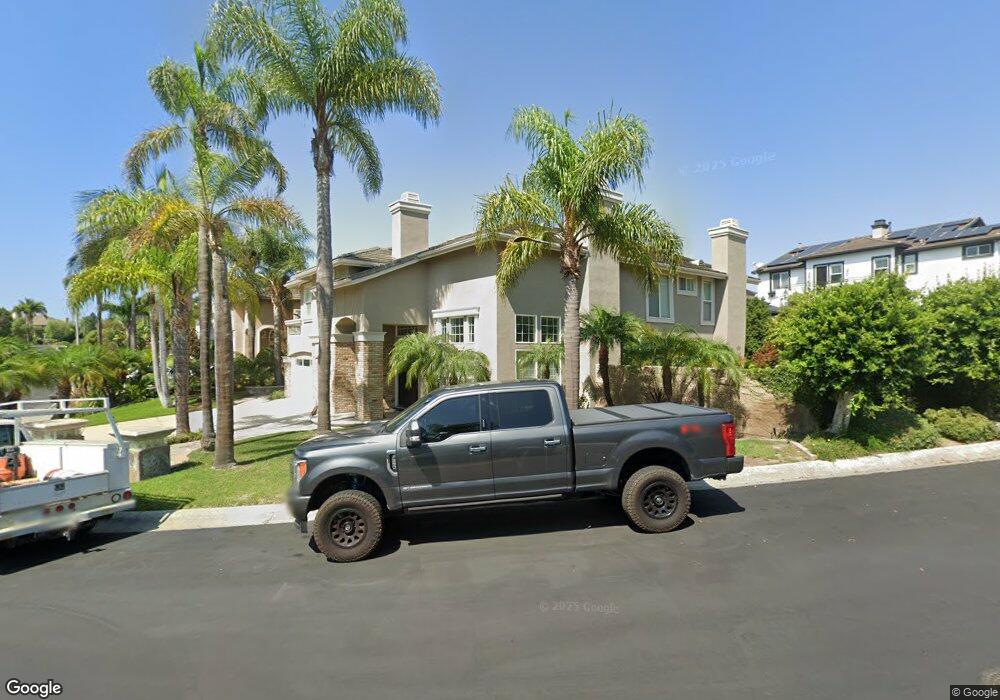
6981 Derby Cir Huntington Beach, CA 92648
Edwards Hill NeighborhoodEstimated Value: $2,761,618 - $3,465,000
5
Beds
5
Baths
3,660
Sq Ft
$871/Sq Ft
Est. Value
About This Home
This home is located at 6981 Derby Cir, Huntington Beach, CA 92648 and is currently estimated at $3,187,405, approximately $870 per square foot. 6981 Derby Cir is a home located in Orange County with nearby schools including Huntington Seacliff Elementary, Ethel Dwyer Middle, and Huntington Beach High School.
Ownership History
Date
Name
Owned For
Owner Type
Purchase Details
Closed on
Feb 28, 2012
Sold by
Harrison Sandra Lee
Bought by
Harrison Sandra L and The Sandra L Harrison Revocable Trust
Current Estimated Value
Purchase Details
Closed on
Sep 29, 2003
Sold by
Harrison Bradley Scott and Harrison Sandra L
Bought by
Harrison Sandra Lee
Home Financials for this Owner
Home Financials are based on the most recent Mortgage that was taken out on this home.
Original Mortgage
$322,700
Outstanding Balance
$137,993
Interest Rate
5%
Mortgage Type
Purchase Money Mortgage
Estimated Equity
$3,049,412
Purchase Details
Closed on
Aug 18, 1997
Sold by
Hb Hamptons Partners Lp
Bought by
Harrison Bradley Scott and Harrison Sandra Lee
Home Financials for this Owner
Home Financials are based on the most recent Mortgage that was taken out on this home.
Original Mortgage
$412,000
Interest Rate
7.54%
Create a Home Valuation Report for This Property
The Home Valuation Report is an in-depth analysis detailing your home's value as well as a comparison with similar homes in the area
Home Values in the Area
Average Home Value in this Area
Purchase History
| Date | Buyer | Sale Price | Title Company |
|---|---|---|---|
| Harrison Sandra L | -- | None Available | |
| Harrison Sandra Lee | -- | North American Title Co | |
| Harrison Bradley Scott | $638,000 | First American Title Ins |
Source: Public Records
Mortgage History
| Date | Status | Borrower | Loan Amount |
|---|---|---|---|
| Open | Harrison Sandra Lee | $322,700 | |
| Closed | Harrison Bradley Scott | $412,000 |
Source: Public Records
Tax History Compared to Growth
Tax History
| Year | Tax Paid | Tax Assessment Tax Assessment Total Assessment is a certain percentage of the fair market value that is determined by local assessors to be the total taxable value of land and additions on the property. | Land | Improvement |
|---|---|---|---|---|
| 2025 | $11,806 | $1,055,974 | $468,660 | $587,314 |
| 2024 | $11,806 | $1,035,269 | $459,470 | $575,799 |
| 2023 | $11,545 | $1,014,970 | $450,461 | $564,509 |
| 2022 | $11,243 | $995,069 | $441,628 | $553,441 |
| 2021 | $11,034 | $975,558 | $432,968 | $542,590 |
| 2020 | $10,964 | $965,555 | $428,528 | $537,027 |
| 2019 | $10,832 | $946,623 | $420,125 | $526,498 |
| 2018 | $10,665 | $928,062 | $411,887 | $516,175 |
| 2017 | $10,524 | $909,865 | $403,811 | $506,054 |
| 2016 | $10,052 | $892,025 | $395,893 | $496,132 |
| 2015 | $9,958 | $878,626 | $389,946 | $488,680 |
| 2014 | $9,750 | $861,415 | $382,307 | $479,108 |
Source: Public Records
Map
Nearby Homes
- 6561 Horseshoe Ln
- 18812 Desmond Ln
- 18976 Rockinghorse Ln
- 6416 Setting Sun Dr
- 6662 Brentwood Dr
- 6632 Cedarwood Dr
- 19011 Main St Unit 129
- 19011 Main St Unit 113
- 18642 Park Glen Ln
- 19061 Main St Unit 101
- 6781 Lawn Haven Dr
- 19071 Main St Unit 117
- 19071 Main St Unit 113
- 19071 Main St Unit 105
- 19051 Main St Unit 101
- 19051 Main St Unit 113
- 19041 Main St Unit 109
- 19031 Main St Unit 105
- 19052 Oceanport Ln Unit 5
- 19115 Callaway Cir
- 6961 Derby Cir
- 6942 Steeplechase Cir
- 6992 Derby Cir
- 6935 Derby Cir
- 18596 Derby Cir
- 6962 Derby Cir
- 6942 Derby Cir
- 6972 Derby Cir
- 6921 Derby Cir
- 18582 Derby Cir
- 6982 Derby Cir
- 6941 Steeplechase Cir
- 6932 Derby Cir
- 6892 Steeplechase Cir
- 6915 Steeplechase Cir
- 18566 Derby Cir
- 6901 Derby Cir
- 6912 Derby Cir
- 6881 Steeplechase Cir
- 6946 Preakness Dr