6982 Langford Ct Unit 3 Edina, MN 55436
Bredesen Park NeighborhoodEstimated payment $1,638/month
Highlights
- 587,189 Sq Ft lot
- Deck
- 1 Car Attached Garage
- Hopkins Senior High School Rated A-
- The kitchen features windows
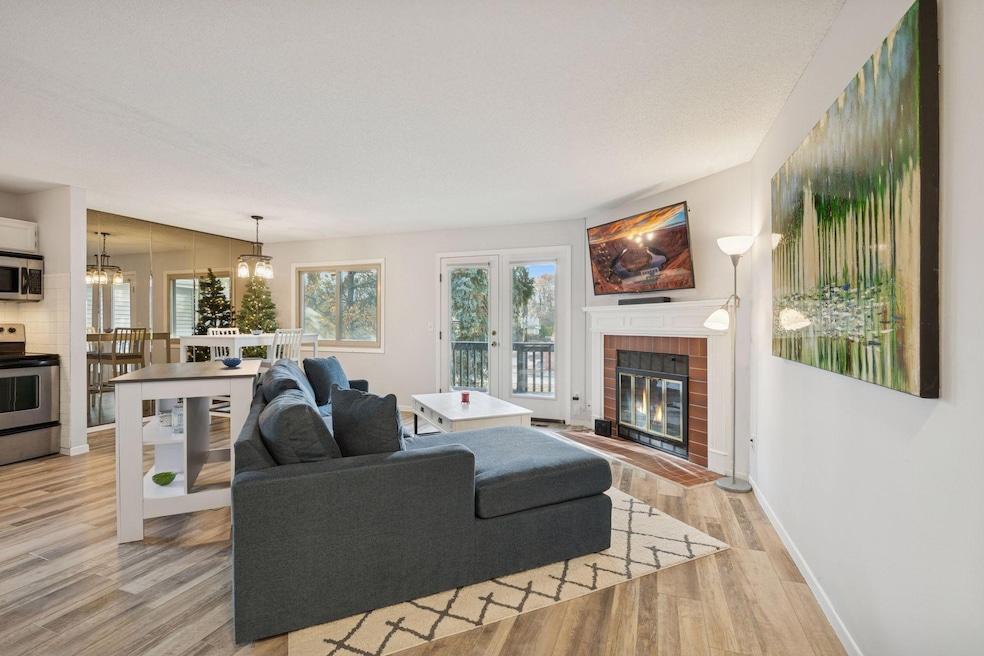
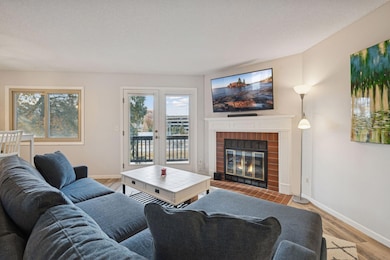
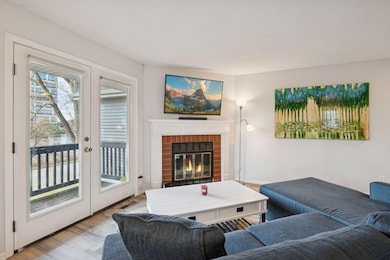
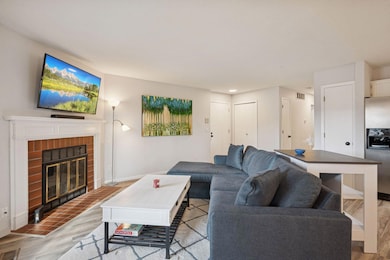
- Living Room
About This Home
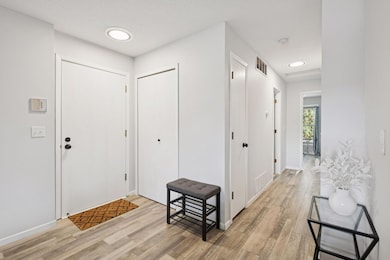
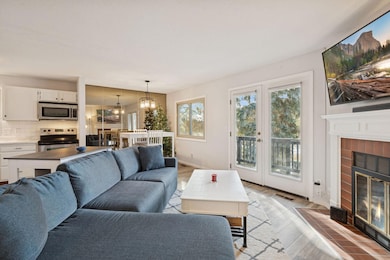
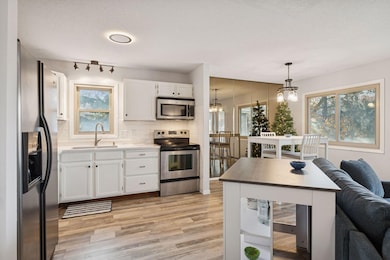
Beautiful upper level Manor home, located conveniently in Edina with easy access to HWY 169, 62 and 212. Luxury plank vinyl flooring throughout. The kitchen was thoughtfully opened up, creating an open main living area, unique from other units in the community. Kitchen features white cabinetry, new quartz countertops, large new undermount sink with window above, stainless steel appliances and pantry. Kitchen opens to dining room and living room. Corner, woodburning fireplace is the focal point in the living room. French doors open onto 15' x 4' west facing deck. Walk through full bathroom with second sink in primary bedroom dressing area. Both sinks feature updated quartz countertops and white cabinetry. Tiled tub surround with shower. Primary bedroom is large with open view from east facing window. Second bedroom is currently used as a den, but offers great flexibility with great closet storage. Brand new stacked washer and dryer in the laundry room. One car attached garage.
Listing Agent
Coldwell Banker Realty Brokerage Phone: 651-442-3245 Listed on: 11/14/2025

Property Details
Home Type
- Multi-Family
Est. Annual Taxes
- $2,051
Year Built
- Built in 1981
HOA Fees
- $338 Monthly HOA Fees
Parking
- 1 Car Attached Garage
Home Design
- Property Attached
Interior Spaces
- 900 Sq Ft Home
- 1-Story Property
- Wood Burning Fireplace
- Living Room
- Dining Room
- The kitchen features windows
- Laundry Room
Bedrooms and Bathrooms
- 2 Bedrooms
- 1 Full Bathroom
Additional Features
- Deck
- 13.48 Acre Lot
- Forced Air Heating and Cooling System
Community Details
- Association fees include maintenance structure, hazard insurance, lawn care, ground maintenance, professional mgmt, sewer, snow removal
- Accredited Association Management Association, Phone Number (651) 882-0400
- Condo 0294 Manor Homes Of Edina Subdivision
Listing and Financial Details
- Assessor Parcel Number 3111721330505
Map
Home Values in the Area
Average Home Value in this Area
Tax History
| Year | Tax Paid | Tax Assessment Tax Assessment Total Assessment is a certain percentage of the fair market value that is determined by local assessors to be the total taxable value of land and additions on the property. | Land | Improvement |
|---|---|---|---|---|
| 2024 | $2,051 | $202,500 | $115,000 | $87,500 |
| 2023 | $1,955 | $192,500 | $105,000 | $87,500 |
| 2022 | $1,560 | $198,900 | $96,000 | $102,900 |
| 2021 | $1,555 | $153,600 | $73,000 | $80,600 |
| 2020 | $1,625 | $153,600 | $73,000 | $80,600 |
| 2019 | $1,374 | $153,600 | $73,000 | $80,600 |
| 2018 | $1,245 | $135,700 | $73,000 | $62,700 |
| 2017 | $935 | $98,200 | $40,000 | $58,200 |
| 2016 | $1,022 | $102,000 | $38,000 | $64,000 |
| 2015 | $921 | $94,000 | $30,000 | $64,000 |
| 2014 | -- | $82,300 | $30,000 | $52,300 |
Property History
| Date | Event | Price | List to Sale | Price per Sq Ft |
|---|---|---|---|---|
| 11/20/2025 11/20/25 | For Sale | $214,500 | -- | $238 / Sq Ft |
Purchase History
| Date | Type | Sale Price | Title Company |
|---|---|---|---|
| Special Warranty Deed | $183,400 | None Listed On Document | |
| Warranty Deed | $219,300 | Zillow Closing Svcs Tx Llc | |
| Warranty Deed | $173,700 | Edina Realty Title Inc | |
| Warranty Deed | $127,600 | -- | |
| Deed | $219,300 | -- |
Mortgage History
| Date | Status | Loan Amount | Loan Type |
|---|---|---|---|
| Previous Owner | $165,060 | New Conventional | |
| Previous Owner | $168,489 | New Conventional |
Source: NorthstarMLS
MLS Number: 6816838
APN: 31-117-21-33-0505
Disclaimer: Certain information contained herein is derived from information provided by parties other than Homes.com. All information provided is deemed reliable, but is not guaranteed to be accurate and should be independently verified.
![]() Based on information submitted to the MLS GRID. All data is obtained from various sources and may not have been verified by broker or MLS GRID. Supplied Open House Information is subject to change without notice. All information should be independently reviewed and verified for accuracy. Properties may or may not be listed by the office/agent presenting the information. Some IDX listings have been excluded from this website.
Based on information submitted to the MLS GRID. All data is obtained from various sources and may not have been verified by broker or MLS GRID. Supplied Open House Information is subject to change without notice. All information should be independently reviewed and verified for accuracy. Properties may or may not be listed by the office/agent presenting the information. Some IDX listings have been excluded from this website.
The Digital Millennium Copyright Act of 1998, 17 U.S.C. § 512 (the “DMCA”) provides recourse for copyright owners who believe that material appearing on the Internet infringes their rights under U.S. copyright law. If you believe in good faith that any content or material made available in connection with our website or services infringes your copyright, you (or your agent) may send us a notice requesting that the content or material be removed, or access to it blocked.
Notices must be sent in writing by email to DMCAnotice@MLSGrid.com.
The DMCA requires that your notice of alleged copyright infringement include the following information:
(1) description of the copyrighted work that is the subject of claimed infringement;
(2) description of the alleged infringing content and information sufficient to permit us to locate the content;
(3) contact information for you, including your address, telephone number and email address;
(4) a statement by you that you have a good faith belief that the content in the manner complained of is not authorized by the copyright owner, or its agent, or by the operation of any law;
(5) a statement by you, signed under penalty of perjury, that the information in the notification is accurate and that you have the authority to enforce the copyrights that are claimed to be infringed; and
(6) a physical or electronic signature of the copyright owner or a person authorized to act on the copyright owner’s behalf. Failure to include all of the above information may result in the delay of the processing of your complaint.
- 6075 Lincoln Dr Unit 110
- 6075 Lincoln Dr Unit 305
- 6075 Lincoln Dr Unit 201
- 6105 Lincoln Dr Unit 239
- 6105 Lincoln Dr Unit 130
- 6105 Lincoln Dr Unit 136
- 6105 Lincoln Dr Unit 231
- 6115 Lincoln Dr Unit 149
- 6085 Lincoln Dr Unit 214
- 6085 Lincoln Dr Unit 220
- 6085 Lincoln Dr Unit 222
- 6804 Langford Dr
- 6110 Waterford Ct S
- 6650 Vernon Ave S Unit 112
- 6710 Vernon Ave S Unit 409
- 6710 Vernon Ave S Unit 307
- 6730 Vernon Ave S Unit 207
- 6730 Vernon Ave S Unit 201
- 6730 Vernon Ave S Unit 402
- 6711 Vernon Ave S
- 5995 Lincoln Dr
- 6730 Vernon Ave S Unit 105
- 10101 Bren Rd E
- 10400 Bren Rd E
- 5645 Green Circle Dr Unit 204
- 10950 Red Circle Dr
- 11001 Bren Rd E
- 5445-5455 Smetana Rd
- 6426 City Pkwy W
- 6572 Regency Ln
- 11050 Red Circle Dr
- 1025 Smetana Rd Unit 3
- 930 Westbrooke Way Unit 930-2
- 806 Old Settlers Trail Unit 8
- 5200 Lincoln Dr
- 935 11th Ave S Unit 3
- 924 Westbrooke Way Unit 7
- 10745 Smetana Rd
- 918 9th Ave S Unit 4
- 900 9th Ave S Unit 7