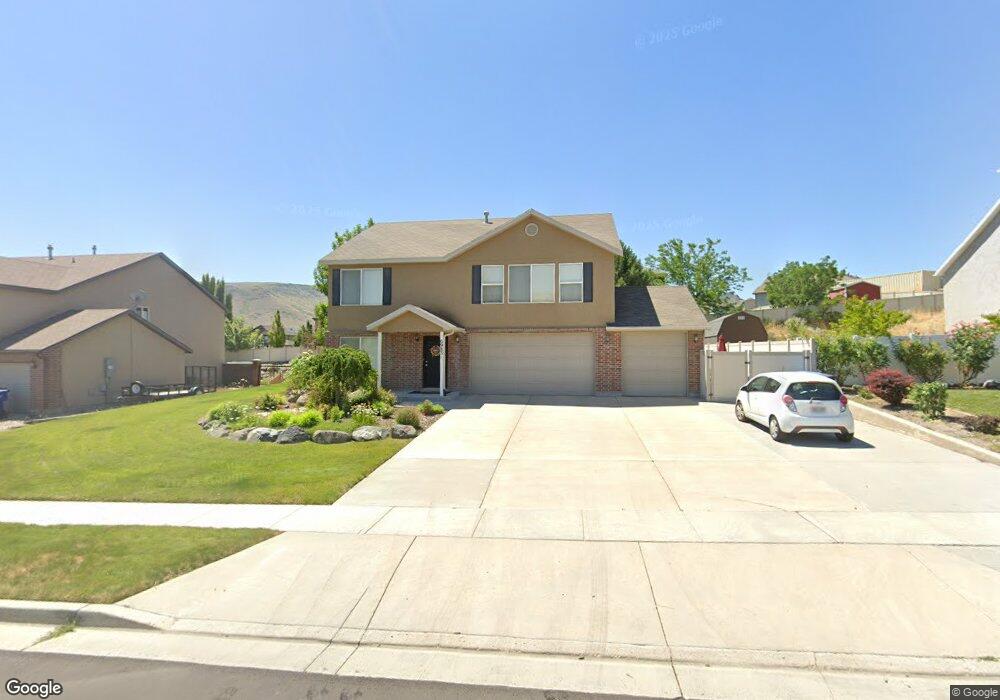
6983 Tracy Loop Rd Herriman, UT 84096
Estimated Value: $588,000 - $674,000
3
Beds
3
Baths
2,460
Sq Ft
$253/Sq Ft
Est. Value
About This Home
This home is located at 6983 Tracy Loop Rd, Herriman, UT 84096 and is currently estimated at $621,784, approximately $252 per square foot. 6983 Tracy Loop Rd is a home located in Salt Lake County with nearby schools including Butterfield Canyon School, Fort Herriman Middle School, and Mountain Ridge High School.
Ownership History
Date
Name
Owned For
Owner Type
Purchase Details
Closed on
Jun 29, 2021
Sold by
Rubin Roy Allen and Rubin Lori Michelle
Bought by
Rubin Roy A and Rubin Lori M
Current Estimated Value
Home Financials for this Owner
Home Financials are based on the most recent Mortgage that was taken out on this home.
Original Mortgage
$72,355
Outstanding Balance
$55,299
Interest Rate
2.9%
Mortgage Type
New Conventional
Estimated Equity
$566,485
Purchase Details
Closed on
Feb 13, 2008
Sold by
Rubin Roy and Rubin Lori
Bought by
Rubin Roy Allen and Rubin Lori Michelle
Purchase Details
Closed on
May 3, 2005
Sold by
Fieldstone Homes Utah Llc
Bought by
Rubin Roy and Rubin Lori
Home Financials for this Owner
Home Financials are based on the most recent Mortgage that was taken out on this home.
Original Mortgage
$103,000
Interest Rate
5.99%
Mortgage Type
Fannie Mae Freddie Mac
Create a Home Valuation Report for This Property
The Home Valuation Report is an in-depth analysis detailing your home's value as well as a comparison with similar homes in the area
Home Values in the Area
Average Home Value in this Area
Purchase History
| Date | Buyer | Sale Price | Title Company |
|---|---|---|---|
| Rubin Roy A | -- | First American Title | |
| Rubin Roy Allen | -- | None Available | |
| Rubin Roy | -- | Us Title Of Utah |
Source: Public Records
Mortgage History
| Date | Status | Borrower | Loan Amount |
|---|---|---|---|
| Open | Rubin Roy A | $72,355 | |
| Closed | Rubin Roy | $103,000 |
Source: Public Records
Tax History
| Year | Tax Paid | Tax Assessment Tax Assessment Total Assessment is a certain percentage of the fair market value that is determined by local assessors to be the total taxable value of land and additions on the property. | Land | Improvement |
|---|---|---|---|---|
| 2025 | $3,483 | $585,600 | $213,000 | $372,600 |
| 2024 | $3,483 | $571,300 | $208,100 | $363,200 |
| 2023 | $3,693 | $573,100 | $167,600 | $405,500 |
| 2022 | $3,677 | $569,000 | $164,300 | $404,700 |
| 2021 | $3,002 | $407,800 | $138,700 | $269,100 |
| 2020 | $2,729 | $349,400 | $138,700 | $210,700 |
| 2019 | $2,803 | $338,900 | $138,700 | $200,200 |
| 2016 | $2,486 | $292,400 | $115,000 | $177,400 |
Source: Public Records
Map
Nearby Homes
- 13947 S Malissa Ann Cir
- 16080 Rose Canyon Rd
- 16229 Rose Canyon Rd
- 13741 Rosie Ln
- 7136 W Blue Bison Ln
- 6656 W Brush Oak Dr
- 14136 Summit Top Ln
- 14136 Summit Top Ln Unit 140
- 14171 S Summit Top Ln
- 14171 S Summit Top Ln Unit 145
- 2889 S Arfons Bay Unit 3
- 14233 S Summit Crest Ln
- 14601 S 6600 W
- 6432 Hollister Way S
- 13599 S White Pony Rd
- 6353 W Pyramid Peak Ln
- 7371 W Summit Crest Cir
- 13334 S Henning Cir
- 13592 S Conie Bell Dr
- 12776 S Petty Ranch Cir
- 6983 W Tracy Loop Rd
- 6967 W Tracy Loop Rd
- 6967 Tracy Loop Rd
- 6997 W Tracy Loop Rd
- 6997 Tracy Loop Rd
- 6978 W Ivie Farms Dr
- 6962 W Ivie Farms Dr
- 6962 W Ivie Farms Dr
- 6957 Tracy Loop Rd
- 6988 Tracy Loop Rd
- 7009 W Tracy Loop Rd
- 7009 Tracy Loop Rd
- 6968 Tracy Loop Rd
- 6968 W Tracy Loop Rd
- 13918 S Gordons View Way
- 6943 Tracy Loop Rd
- 6943 W Tracy Loop Rd
- 7008 Tracy Loop Rd
- 6948 W Tracy Loop Rd
- 6948 Tracy Loop Rd
Your Personal Tour Guide
Ask me questions while you tour the home.