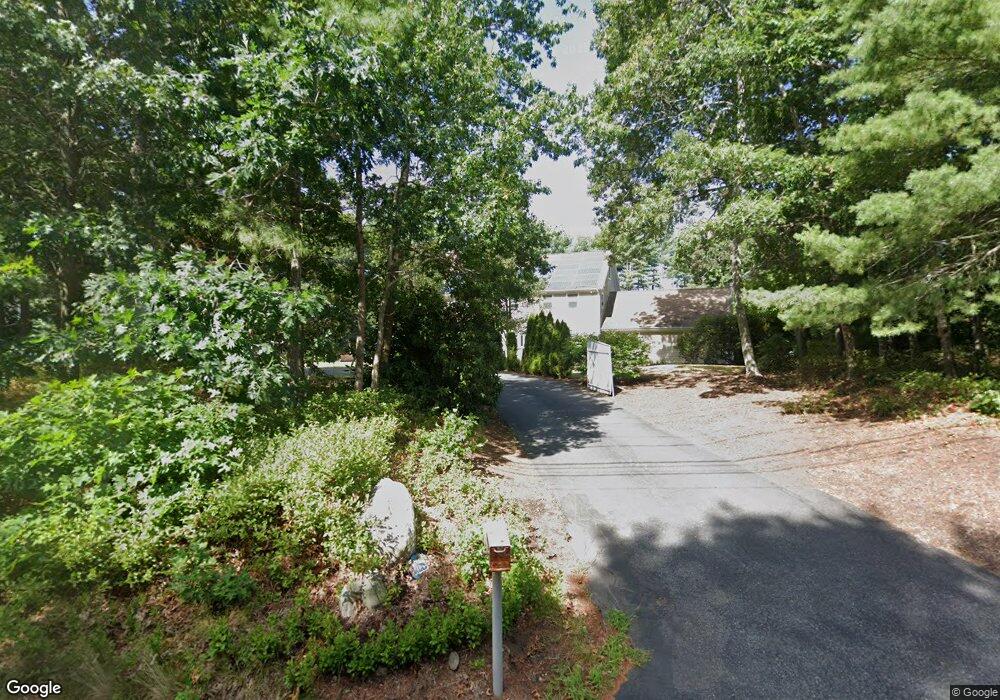
699 Center St Pembroke, MA 02359
Estimated Value: $913,887 - $1,055,000
--
Bed
3
Baths
3,930
Sq Ft
$251/Sq Ft
Est. Value
About This Home
This home is located at 699 Center St, Pembroke, MA 02359 and is currently estimated at $985,222, approximately $250 per square foot. 699 Center St is a home located in Plymouth County with nearby schools including Pembroke High School.
Ownership History
Date
Name
Owned For
Owner Type
Purchase Details
Closed on
Mar 15, 2005
Sold by
Hanlon Lawrence J and Hanlon Dianne M
Bought by
Hanlon Nt and Hanlon Lawrence J
Current Estimated Value
Purchase Details
Closed on
Dec 23, 1993
Sold by
Lafargue Family Ift and Thibodeaux Blance
Bought by
Hanlon Lawrence J and Falling Dianne M
Create a Home Valuation Report for This Property
The Home Valuation Report is an in-depth analysis detailing your home's value as well as a comparison with similar homes in the area
Home Values in the Area
Average Home Value in this Area
Purchase History
| Date | Buyer | Sale Price | Title Company |
|---|---|---|---|
| Hanlon Nt | -- | -- | |
| Hanlon Lawrence J | $56,000 | -- |
Source: Public Records
Mortgage History
| Date | Status | Borrower | Loan Amount |
|---|---|---|---|
| Previous Owner | Hanlon Lawrence J | $100,000 | |
| Previous Owner | Hanlon Lawrence J | $15,000 | |
| Previous Owner | Hanlon Lawrence J | $80,000 |
Source: Public Records
Tax History Compared to Growth
Tax History
| Year | Tax Paid | Tax Assessment Tax Assessment Total Assessment is a certain percentage of the fair market value that is determined by local assessors to be the total taxable value of land and additions on the property. | Land | Improvement |
|---|---|---|---|---|
| 2025 | $9,819 | $816,900 | $277,300 | $539,600 |
| 2024 | $9,741 | $809,700 | $270,800 | $538,900 |
| 2023 | $9,378 | $737,300 | $270,800 | $466,500 |
| 2022 | $8,915 | $630,000 | $221,600 | $408,400 |
| 2021 | $8,803 | $603,800 | $211,300 | $392,500 |
| 2020 | $8,500 | $586,600 | $201,900 | $384,700 |
| 2019 | $8,125 | $556,500 | $196,800 | $359,700 |
| 2018 | $7,795 | $523,500 | $181,600 | $341,900 |
| 2017 | $7,713 | $510,800 | $171,800 | $339,000 |
| 2016 | $7,621 | $499,400 | $162,000 | $337,400 |
| 2015 | $7,170 | $486,400 | $147,100 | $339,300 |
Source: Public Records
Map
Nearby Homes