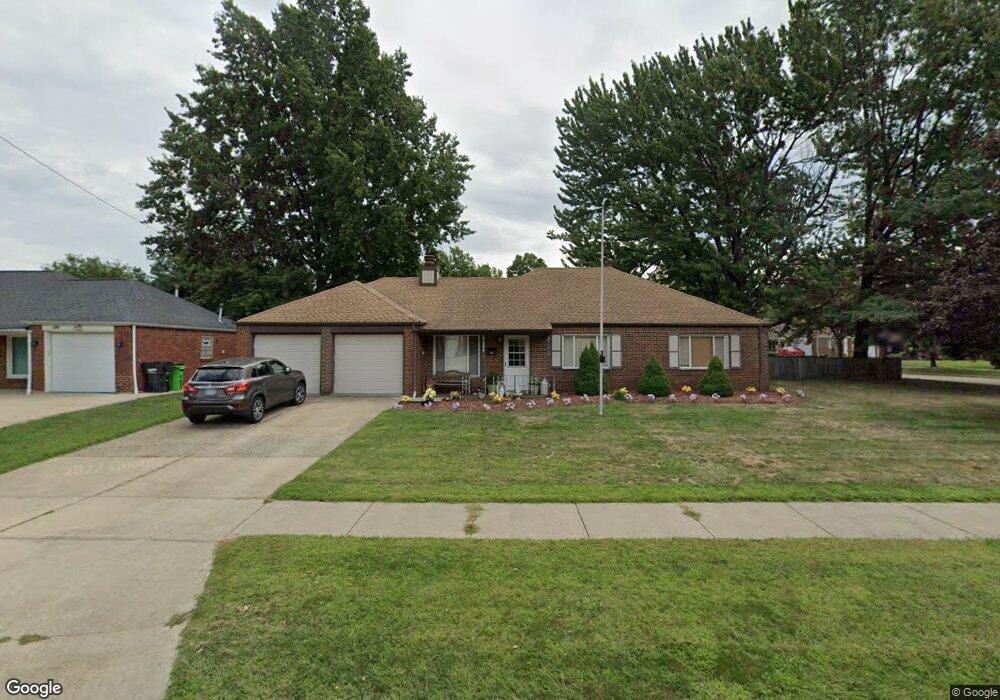
699 Sycamore Dr Euclid, OH 44132
Estimated Value: $194,000 - $206,000
3
Beds
2
Baths
1,785
Sq Ft
$113/Sq Ft
Est. Value
About This Home
This home is located at 699 Sycamore Dr, Euclid, OH 44132 and is currently estimated at $202,135, approximately $113 per square foot. 699 Sycamore Dr is a home located in Cuyahoga County with nearby schools including Shoreview Elementary School, Euclid High School, and Ss. Robert & William Catholic School.
Ownership History
Date
Name
Owned For
Owner Type
Purchase Details
Closed on
May 6, 1985
Sold by
Ostrom Michael K
Bought by
Campana Michael C
Current Estimated Value
Purchase Details
Closed on
Feb 22, 1985
Sold by
Ostrom Stephen and Ostrom Michael K
Bought by
Schwartz Peggy Jo
Purchase Details
Closed on
Sep 14, 1983
Sold by
Stephen Ostrom
Bought by
Ostrom Stephen and Ostrom Michael K
Purchase Details
Closed on
Jul 26, 1983
Sold by
Ostrom Stephen
Bought by
Stephen Ostrom
Purchase Details
Closed on
Jan 27, 1983
Sold by
Nancy C Putnam
Bought by
Putnam Nancy
Purchase Details
Closed on
Aug 28, 1979
Sold by
Ostrom Nancy C
Bought by
Nancy C Putnam
Purchase Details
Closed on
Jan 1, 1975
Bought by
Ostrom Nancy C
Create a Home Valuation Report for This Property
The Home Valuation Report is an in-depth analysis detailing your home's value as well as a comparison with similar homes in the area
Home Values in the Area
Average Home Value in this Area
Purchase History
| Date | Buyer | Sale Price | Title Company |
|---|---|---|---|
| Campana Michael C | $53,000 | -- | |
| Ostrom Michael K | -- | -- | |
| Schwartz Peggy Jo | -- | -- | |
| Ostrom Stephen | -- | -- | |
| Stephen Ostrom | -- | -- | |
| Ostrom Stephen | -- | -- | |
| Putnam Nancy | -- | -- | |
| Nancy C Putnam | -- | -- | |
| Ostrom Nancy C | -- | -- |
Source: Public Records
Tax History Compared to Growth
Tax History
| Year | Tax Paid | Tax Assessment Tax Assessment Total Assessment is a certain percentage of the fair market value that is determined by local assessors to be the total taxable value of land and additions on the property. | Land | Improvement |
|---|---|---|---|---|
| 2024 | $3,543 | $61,250 | $12,705 | $48,545 |
| 2023 | $3,214 | $46,340 | $11,130 | $35,210 |
| 2022 | $3,174 | $46,340 | $11,130 | $35,210 |
| 2021 | $3,527 | $46,340 | $11,130 | $35,210 |
| 2020 | $3,608 | $35,110 | $8,440 | $26,670 |
| 2019 | $3,246 | $100,300 | $24,100 | $76,200 |
| 2018 | $3,179 | $35,110 | $8,440 | $26,670 |
| 2017 | $3,345 | $29,890 | $6,790 | $23,100 |
| 2016 | $3,352 | $29,890 | $6,790 | $23,100 |
| 2015 | $3,049 | $29,890 | $6,790 | $23,100 |
| 2014 | $3,049 | $29,890 | $6,790 | $23,100 |
Source: Public Records
Map
Nearby Homes
- 27190 Shoreview Ave
- 577 Sycamore Dr
- 27101 Zeman Ave
- 29038 Fuller Ave
- 559 Sycamore Dr
- 546 Walnut Dr
- 712 E 266th St
- 780 E 266th St
- 26471 Farringdon Ave
- 461 E 271st St
- 26430 Drakefield Ave
- 970 Bryn Mawr Ave
- 26471 Shoreview Ave
- 26351 Farringdon Ave
- 440 E 271st St
- 635 E 261st St
- 445 E 275th St
- 640 E 261st St
- 26171 Shoreview Ave
- 415 E 266th St