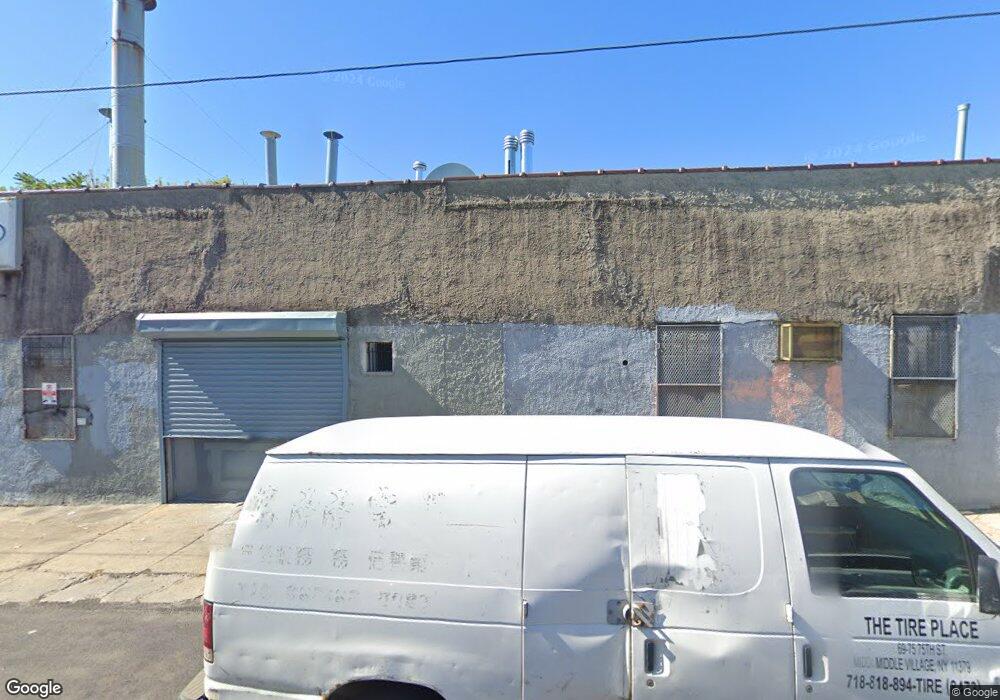
6990 75th St Flushing, NY 11379
Middle Village NeighborhoodEstimated Value: $1,764,467
Studio
--
Bath
4,204
Sq Ft
$420/Sq Ft
Est. Value
About This Home
This home is located at 6990 75th St, Flushing, NY 11379 and is currently estimated at $1,764,467, approximately $419 per square foot. 6990 75th St is a home located in Queens County with nearby schools including P.S. 87 - Middle Village, Queens Metropolitan High School, and The Kew-Forest School.
Ownership History
Date
Name
Owned For
Owner Type
Purchase Details
Closed on
Mar 22, 2017
Sold by
69 Middle Village Corp
Bought by
Emir Holdings Llc
Current Estimated Value
Home Financials for this Owner
Home Financials are based on the most recent Mortgage that was taken out on this home.
Original Mortgage
$1,000,000
Outstanding Balance
$828,792
Interest Rate
4.15%
Mortgage Type
Commercial
Estimated Equity
$935,675
Create a Home Valuation Report for This Property
The Home Valuation Report is an in-depth analysis detailing your home's value as well as a comparison with similar homes in the area
Home Values in the Area
Average Home Value in this Area
Purchase History
| Date | Buyer | Sale Price | Title Company |
|---|---|---|---|
| Emir Holdings Llc | $1,440,000 | -- |
Source: Public Records
Mortgage History
| Date | Status | Borrower | Loan Amount |
|---|---|---|---|
| Open | Emir Holdings Llc | $1,000,000 |
Source: Public Records
Tax History
| Year | Tax Paid | Tax Assessment Tax Assessment Total Assessment is a certain percentage of the fair market value that is determined by local assessors to be the total taxable value of land and additions on the property. | Land | Improvement |
|---|---|---|---|---|
| 2025 | $30,114 | $282,600 | $63,000 | $219,600 |
| 2024 | $30,114 | $284,310 | $63,000 | $221,310 |
| 2023 | $29,485 | $278,370 | $63,000 | $215,370 |
| 2022 | $29,193 | $281,250 | $63,000 | $218,250 |
| 2021 | $26,564 | $248,400 | $63,000 | $185,400 |
| 2020 | $26,785 | $293,400 | $63,000 | $230,400 |
| 2019 | $25,601 | $274,500 | $63,000 | $211,500 |
| 2018 | $23,755 | $225,940 | $63,000 | $162,940 |
| 2017 | $21,974 | $208,997 | $63,000 | $145,997 |
| 2016 | $21,477 | $208,997 | $63,000 | $145,997 |
| 2015 | $12,280 | $186,368 | $63,000 | $123,368 |
| 2014 | $12,280 | $169,899 | $63,000 | $106,899 |
Source: Public Records
Map
Nearby Homes
Your Personal Tour Guide
Ask me questions while you tour the home.