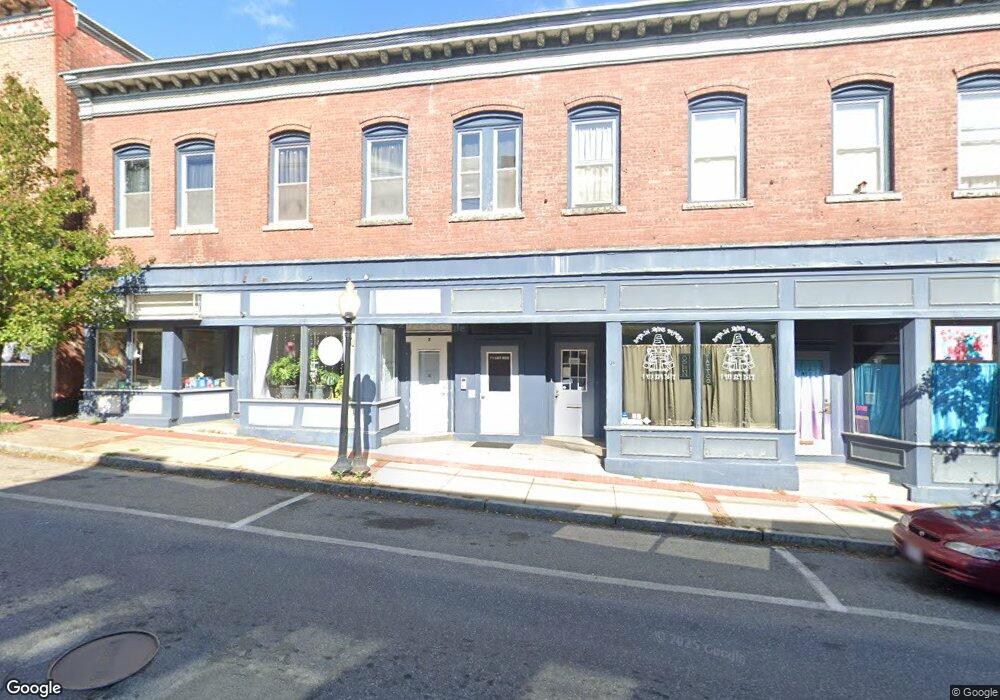
7-11 E Main St Orange, MA 01364
Estimated Value: $702,426
4
Beds
9
Baths
7,635
Sq Ft
$92/Sq Ft
Est. Value
About This Home
This home is located at 7-11 E Main St, Orange, MA 01364 and is currently estimated at $702,426, approximately $92 per square foot. 7-11 E Main St is a home located in Franklin County with nearby schools including Fisher Hill and Ralph C Mahar Regional School.
Ownership History
Date
Name
Owned For
Owner Type
Purchase Details
Closed on
Aug 22, 2008
Sold by
Tessitore Prop Rt 8 and Tessitore
Bought by
Georgilas George
Current Estimated Value
Home Financials for this Owner
Home Financials are based on the most recent Mortgage that was taken out on this home.
Original Mortgage
$260,000
Outstanding Balance
$171,230
Interest Rate
6.4%
Mortgage Type
Commercial
Estimated Equity
$531,196
Purchase Details
Closed on
Nov 17, 2003
Sold by
Drazek John P
Bought by
Tessitore Derek and Tessitore James
Home Financials for this Owner
Home Financials are based on the most recent Mortgage that was taken out on this home.
Original Mortgage
$50,000
Interest Rate
5.81%
Mortgage Type
Commercial
Purchase Details
Closed on
Aug 30, 2001
Sold by
Cook Ct Rt
Bought by
Drazek John P
Purchase Details
Closed on
Sep 12, 2000
Sold by
Brooks David C
Bought by
Cook Court Realty Tr
Create a Home Valuation Report for This Property
The Home Valuation Report is an in-depth analysis detailing your home's value as well as a comparison with similar homes in the area
Home Values in the Area
Average Home Value in this Area
Purchase History
| Date | Buyer | Sale Price | Title Company |
|---|---|---|---|
| Georgilas George | $325,000 | -- | |
| Georgilas George | $325,000 | -- | |
| Tessitore Derek | $130,000 | -- | |
| Tessitore Derek | $130,000 | -- | |
| Drazek John P | $137,000 | -- | |
| Drazek John P | $137,000 | -- | |
| Cook Court Realty Tr | $127,610 | -- | |
| Cook Court Realty Tr | $127,610 | -- |
Source: Public Records
Mortgage History
| Date | Status | Borrower | Loan Amount |
|---|---|---|---|
| Open | Georgilas George | $260,000 | |
| Closed | Cook Court Realty Tr | $260,000 | |
| Previous Owner | Cook Court Realty Tr | $50,000 |
Source: Public Records
Tax History Compared to Growth
Tax History
| Year | Tax Paid | Tax Assessment Tax Assessment Total Assessment is a certain percentage of the fair market value that is determined by local assessors to be the total taxable value of land and additions on the property. | Land | Improvement |
|---|---|---|---|---|
| 2025 | $5,565 | $338,300 | $30,400 | $307,900 |
| 2024 | $5,783 | $331,600 | $30,400 | $301,200 |
| 2023 | $5,956 | $331,600 | $30,400 | $301,200 |
| 2022 | $7,847 | $410,400 | $30,400 | $380,000 |
| 2021 | $5,037 | $251,200 | $40,400 | $210,800 |
| 2020 | $4,999 | $245,900 | $38,900 | $207,000 |
| 2019 | $5,157 | $229,000 | $37,100 | $191,900 |
| 2018 | $4,912 | $223,900 | $35,700 | $188,200 |
| 2017 | $4,751 | $223,800 | $35,700 | $188,100 |
| 2016 | $4,731 | $218,000 | $35,700 | $182,300 |
| 2015 | $4,856 | $233,800 | $35,700 | $198,100 |
| 2014 | -- | $233,800 | $35,700 | $198,100 |
Source: Public Records
Map
Nearby Homes
- 12-14 E Main St
- 50 E Main St
- 36 Summit St Unit A
- 36 Summit St Unit B
- 83 W Main St
- 52 Mechanic St
- 102 W Main St
- 150 E Main St
- 73-75 Pleasant St
- 27 Chase St
- 166-168 W Main St
- 50 W Myrtle St
- 37 Cottage St
- 222 W River St
- 39 Terrace St
- 75 Sandrah Dr
- 490 S Main St
- 60 Stone Valley Rd
- 520 S Main St
- 216 Holtshire Rd
- 11 E Main St
- 7 E Main St Unit 1
- 7 E Main St
- 711 E Main St
- 15 E Main St Unit 17
- 15 E Main St
- 15 E Main St
- 1 E Main St
- 15-17 E Main St
- 6 N Main St
- 6 N Main St
- 12 E Main St Unit 14
- 3 E Main St
- 14 E Main St
- 12-14-14 E Main St Unit 2
- 12-14-14 E Main St Unit 1
- 12-14-14 E Main St
- 12 N Main St
- 5 S Main St
- 3 S Main St