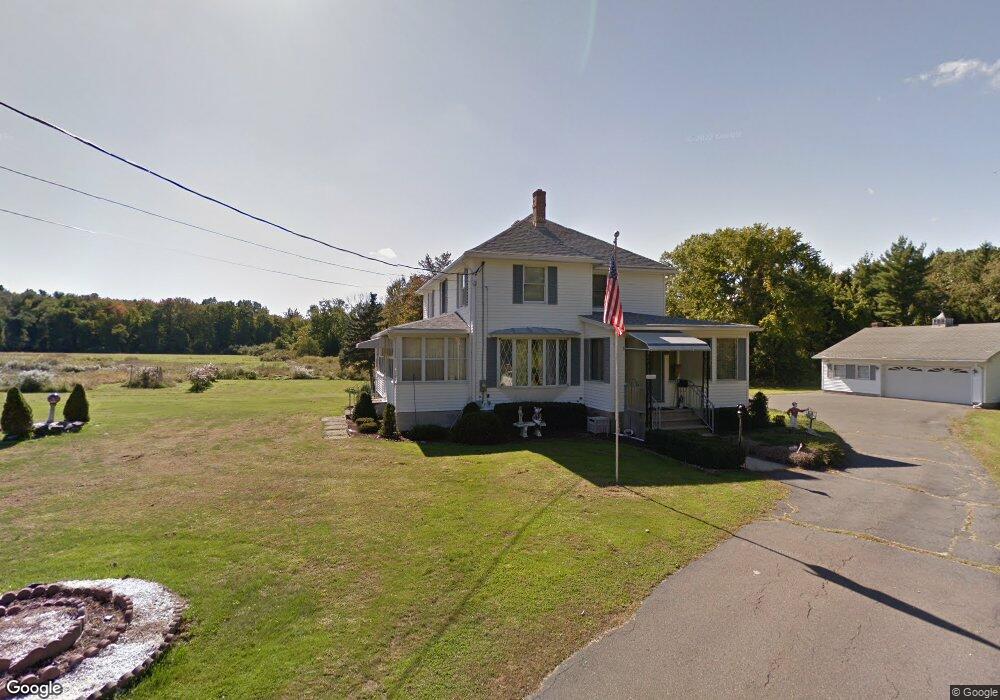
7 2nd Ave Easthampton, MA 01027
Estimated Value: $419,000 - $548,000
4
Beds
3
Baths
1,944
Sq Ft
$256/Sq Ft
Est. Value
About This Home
This home is located at 7 2nd Ave, Easthampton, MA 01027 and is currently estimated at $498,066, approximately $256 per square foot. 7 2nd Ave is a home located in Hampshire County with nearby schools including Easthampton High School, Hilltown Cooperative Charter Public School, and Tri-County Schools.
Ownership History
Date
Name
Owned For
Owner Type
Purchase Details
Closed on
Jan 7, 2020
Sold by
Laflamme Samantha J
Bought by
Mock Michaelene
Current Estimated Value
Home Financials for this Owner
Home Financials are based on the most recent Mortgage that was taken out on this home.
Original Mortgage
$29,800
Outstanding Balance
$26,329
Interest Rate
3.6%
Mortgage Type
New Conventional
Estimated Equity
$471,737
Purchase Details
Closed on
Aug 24, 2017
Sold by
Mock William D and Mock Michaelene
Bought by
Mock William D and Mock Michaelene
Purchase Details
Closed on
Aug 19, 2016
Sold by
Stanley and Rzeszutek Anne Rzeszutek
Bought by
Mock William D and Mock Michaelene
Home Financials for this Owner
Home Financials are based on the most recent Mortgage that was taken out on this home.
Original Mortgage
$177,150
Interest Rate
3.41%
Mortgage Type
New Conventional
Purchase Details
Closed on
Jan 28, 2005
Sold by
Rzeszutek Anne M
Bought by
Rzeszutek Tr Anne M and Rzeszutek Stanley L
Create a Home Valuation Report for This Property
The Home Valuation Report is an in-depth analysis detailing your home's value as well as a comparison with similar homes in the area
Home Values in the Area
Average Home Value in this Area
Purchase History
| Date | Buyer | Sale Price | Title Company |
|---|---|---|---|
| Mock Michaelene | $30,000 | None Available | |
| Mock William D | -- | -- | |
| Mock William D | $221,443 | -- | |
| Rzeszutek Tr Anne M | -- | -- |
Source: Public Records
Mortgage History
| Date | Status | Borrower | Loan Amount |
|---|---|---|---|
| Open | Mock Michaelene | $29,800 | |
| Previous Owner | Mock William D | $177,150 |
Source: Public Records
Tax History
| Year | Tax Paid | Tax Assessment Tax Assessment Total Assessment is a certain percentage of the fair market value that is determined by local assessors to be the total taxable value of land and additions on the property. | Land | Improvement |
|---|---|---|---|---|
| 2025 | $6,350 | $464,500 | $127,500 | $337,000 |
| 2024 | $6,342 | $467,700 | $138,800 | $328,900 |
| 2023 | $4,930 | $336,500 | $113,500 | $223,000 |
| 2022 | $5,562 | $336,500 | $113,500 | $223,000 |
| 2021 | $6,081 | $346,700 | $113,500 | $233,200 |
| 2020 | $5,976 | $336,500 | $113,500 | $223,000 |
| 2019 | $4,919 | $318,200 | $113,500 | $204,700 |
| 2018 | $4,776 | $298,500 | $108,000 | $190,500 |
| 2017 | $4,615 | $284,700 | $104,400 | $180,300 |
| 2016 | $4,407 | $282,700 | $104,400 | $178,300 |
| 2015 | $4,283 | $282,700 | $104,400 | $178,300 |
Source: Public Records
Map
Nearby Homes
- 29 Parsons St Unit 1
- 18-20 Oakdale Place
- 2 Oak St
- 12 Glen Cove Place Unit B
- 10 Glen Cove Place Unit A
- 40 Clark St
- 33 Knipfer Ave
- 4 Gaugh St
- 211 East St Unit 11
- 19 Nicols Way Unit 19
- 7 Union Ct
- 11 Dragon Cir
- 6 Wilton Rd
- 41 South St Unit 11
- 336 Main St
- 385 Main St
- 6 S St & Abutting Lots
- 36 & 36R Holly Cir
- M143 &152 Glendale St
- 2 W Park Dr
Your Personal Tour Guide
Ask me questions while you tour the home.