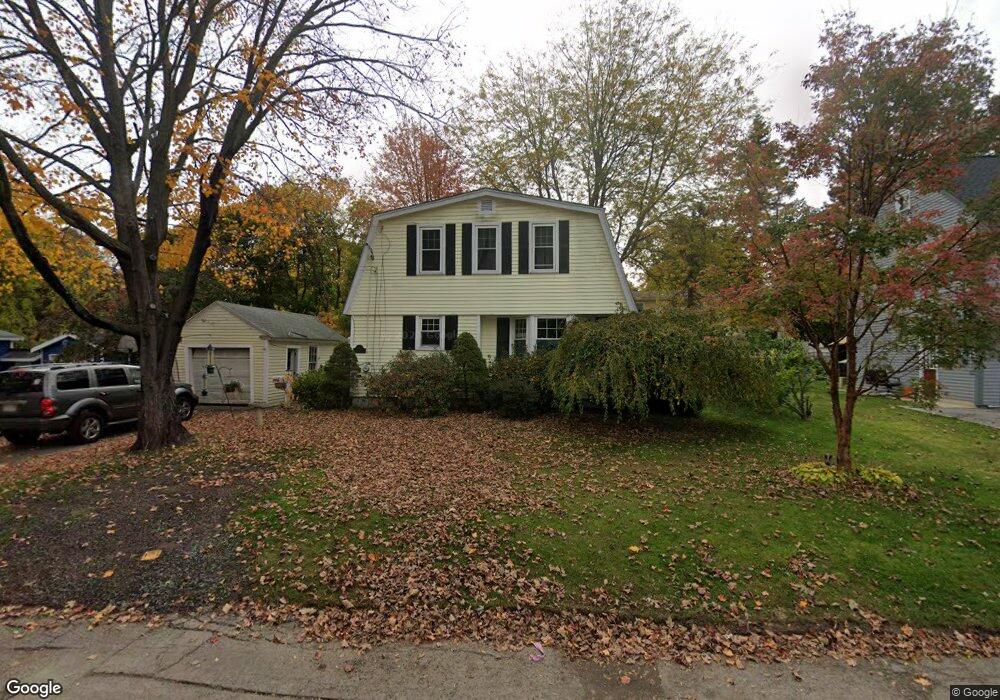
7 2nd St Hudson, MA 01749
Estimated Value: $546,000 - $636,000
3
Beds
2
Baths
1,428
Sq Ft
$406/Sq Ft
Est. Value
About This Home
This home is located at 7 2nd St, Hudson, MA 01749 and is currently estimated at $579,751, approximately $405 per square foot. 7 2nd St is a home located in Middlesex County with nearby schools including David J. Quinn Middle School, Hudson High School, and First Steps Children's Center.
Ownership History
Date
Name
Owned For
Owner Type
Purchase Details
Closed on
Feb 1, 2024
Sold by
Nattress Daniel T
Bought by
Daniel T Nattress T T and Daniel Nattress
Current Estimated Value
Purchase Details
Closed on
Jan 4, 1995
Sold by
Perkins Richard and Cibelli Julie M
Bought by
Nattress Daniel T
Purchase Details
Closed on
Feb 29, 1988
Sold by
Murphy James K
Bought by
Perkins Richard D
Create a Home Valuation Report for This Property
The Home Valuation Report is an in-depth analysis detailing your home's value as well as a comparison with similar homes in the area
Home Values in the Area
Average Home Value in this Area
Purchase History
| Date | Buyer | Sale Price | Title Company |
|---|---|---|---|
| Daniel T Nattress T T | -- | None Available | |
| Nattress Daniel T | $133,900 | -- | |
| Perkins Richard D | $146,900 | -- |
Source: Public Records
Mortgage History
| Date | Status | Borrower | Loan Amount |
|---|---|---|---|
| Previous Owner | Perkins Richard D | $113,000 | |
| Previous Owner | Perkins Richard D | $16,000 | |
| Previous Owner | Perkins Richard D | $8,000 |
Source: Public Records
Tax History Compared to Growth
Tax History
| Year | Tax Paid | Tax Assessment Tax Assessment Total Assessment is a certain percentage of the fair market value that is determined by local assessors to be the total taxable value of land and additions on the property. | Land | Improvement |
|---|---|---|---|---|
| 2025 | $7,154 | $515,400 | $166,800 | $348,600 |
| 2024 | $6,775 | $483,900 | $151,600 | $332,300 |
| 2023 | $6,548 | $448,500 | $145,800 | $302,700 |
| 2022 | $5,894 | $371,600 | $132,500 | $239,100 |
| 2021 | $5,745 | $346,300 | $126,200 | $220,100 |
| 2020 | $5,576 | $335,700 | $123,700 | $212,000 |
| 2019 | $5,690 | $334,100 | $123,700 | $210,400 |
| 2018 | $5,304 | $303,100 | $117,800 | $185,300 |
| 2017 | $4,904 | $280,200 | $112,200 | $168,000 |
| 2016 | $4,737 | $274,000 | $112,200 | $161,800 |
| 2015 | $4,542 | $263,000 | $112,200 | $150,800 |
| 2014 | $4,339 | $249,100 | $98,300 | $150,800 |
Source: Public Records
Map
Nearby Homes
- 1 Barracks Rd Unit 1
- 133 Lincoln St
- 104 Lincoln St
- 74 Cox St Unit 9
- 200 Manning St Unit 6C
- 200 Manning St Unit 14B
- 55 Cottage St
- 18-24 River St Unit 1
- 65 Main St
- 4 Linden St
- 248 Main St Unit 207
- 248 Main St Unit 216
- 30 Maple St
- 16 Houghton St
- 17 School St Unit C
- 17 School St Unit A
- 21 Gates Ave
- 223 Central St
- 2 Edith Rd
- 76 Woobly Rd