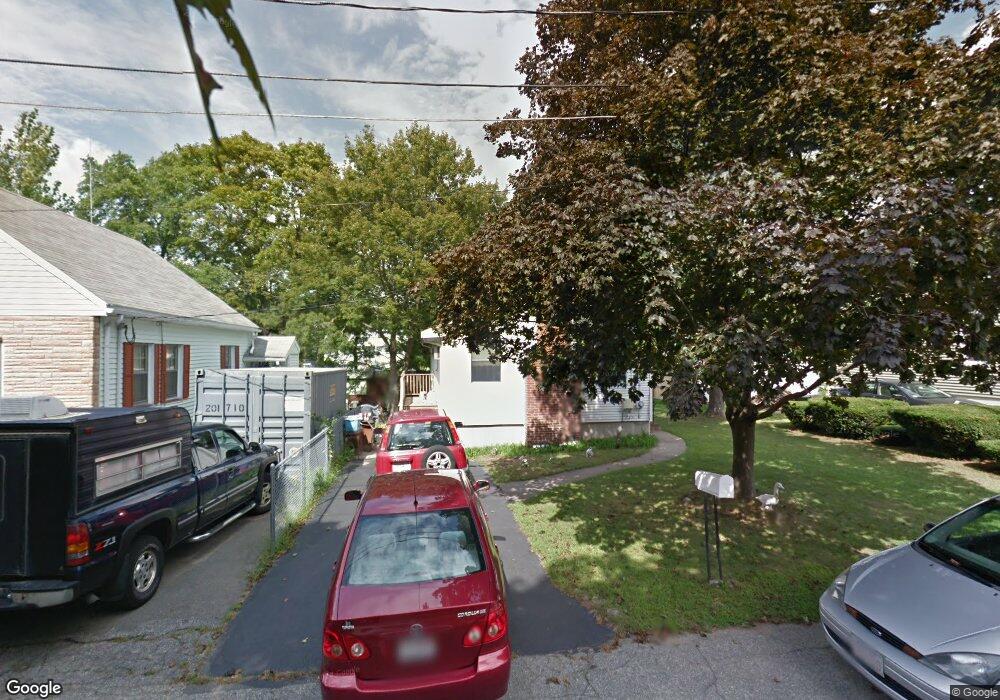
7 2nd St Wakefield, MA 01880
Montrose NeighborhoodEstimated Value: $629,000 - $709,000
3
Beds
2
Baths
1,462
Sq Ft
$459/Sq Ft
Est. Value
About This Home
This home is located at 7 2nd St, Wakefield, MA 01880 and is currently estimated at $671,365, approximately $459 per square foot. 7 2nd St is a home located in Middlesex County with nearby schools including Wakefield Memorial High School, St Joseph School, and Odyssey Day School.
Ownership History
Date
Name
Owned For
Owner Type
Purchase Details
Closed on
Apr 11, 1994
Sold by
Tierney Margaret M
Bought by
Tan Anling and Tan Ramon B
Current Estimated Value
Home Financials for this Owner
Home Financials are based on the most recent Mortgage that was taken out on this home.
Original Mortgage
$133,285
Interest Rate
7.27%
Mortgage Type
Purchase Money Mortgage
Create a Home Valuation Report for This Property
The Home Valuation Report is an in-depth analysis detailing your home's value as well as a comparison with similar homes in the area
Home Values in the Area
Average Home Value in this Area
Purchase History
| Date | Buyer | Sale Price | Title Company |
|---|---|---|---|
| Tan Anling | $140,300 | -- |
Source: Public Records
Mortgage History
| Date | Status | Borrower | Loan Amount |
|---|---|---|---|
| Open | Tan Anling | $129,000 | |
| Closed | Tan Anling | $133,285 |
Source: Public Records
Tax History
| Year | Tax Paid | Tax Assessment Tax Assessment Total Assessment is a certain percentage of the fair market value that is determined by local assessors to be the total taxable value of land and additions on the property. | Land | Improvement |
|---|---|---|---|---|
| 2025 | $5,930 | $522,500 | $335,700 | $186,800 |
| 2024 | $5,843 | $519,400 | $333,700 | $185,700 |
| 2023 | $5,558 | $473,800 | $304,400 | $169,400 |
| 2022 | $5,316 | $431,500 | $277,200 | $154,300 |
| 2021 | $5,196 | $408,200 | $258,400 | $149,800 |
| 2020 | $4,874 | $381,700 | $241,600 | $140,100 |
| 2019 | $4,656 | $362,900 | $229,700 | $133,200 |
| 2018 | $4,334 | $334,700 | $211,900 | $122,800 |
| 2017 | $4,076 | $312,800 | $198,000 | $114,800 |
| 2016 | $4,046 | $299,900 | $187,300 | $112,600 |
| 2015 | $3,778 | $280,300 | $175,000 | $105,300 |
| 2014 | $3,444 | $269,500 | $168,300 | $101,200 |
Source: Public Records
Map
Nearby Homes
- 68 Preston St Unit 6D
- 9 Cyrus St
- 350 Water St
- 16 Pleasant St
- 10 Wakefield Ave Unit B
- 35 Richardson St Unit 2
- 43-45 Crescent St
- 21 Herbert St Unit A
- 1 Traverse St Unit E
- 57 Wave Ave
- 61 Nahant St
- 34 Stark Ave
- 0 Everett St
- 62 Foundry St Unit 310
- 62 Foundry St Unit 204
- 62 Foundry St Unit 402
- 62 Foundry St Unit 507
- 62 Foundry St Unit 208
- 62 Foundry St Unit 414
- 62 Foundry St Unit 210
Your Personal Tour Guide
Ask me questions while you tour the home.