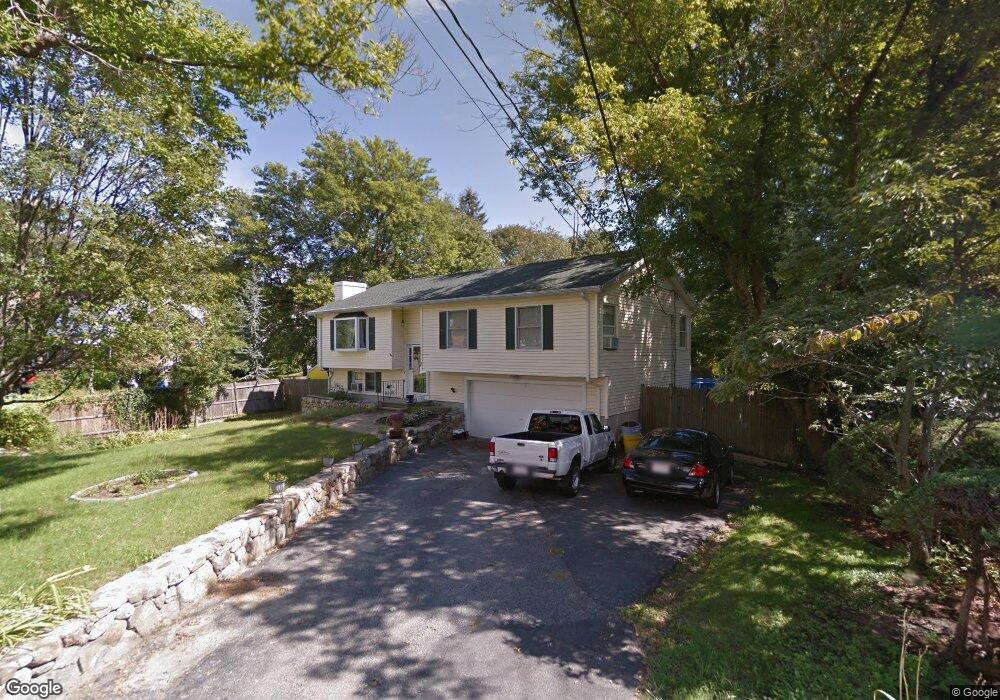
7 Alicia St Framingham, MA 01702
Estimated Value: $615,000 - $772,000
4
Beds
2
Baths
1,236
Sq Ft
$543/Sq Ft
Est. Value
About This Home
This home is located at 7 Alicia St, Framingham, MA 01702 and is currently estimated at $671,658, approximately $543 per square foot. 7 Alicia St is a home located in Middlesex County with nearby schools including Framingham High School, Pincushion Hill Montessori School, and Saint Bridget School.
Ownership History
Date
Name
Owned For
Owner Type
Purchase Details
Closed on
Jan 15, 2025
Sold by
Chase Michael R and Chase Kathy S
Bought by
Michael And Kathy Ret and Chase
Current Estimated Value
Purchase Details
Closed on
Oct 2, 2000
Sold by
Feliciano Jose R and Feliciano Idalia
Bought by
Chase Michael R and Chase Kathy S
Home Financials for this Owner
Home Financials are based on the most recent Mortgage that was taken out on this home.
Original Mortgage
$188,000
Interest Rate
7.94%
Mortgage Type
Purchase Money Mortgage
Purchase Details
Closed on
Apr 14, 1995
Sold by
Lin Carl M
Bought by
Feliciano Jose R and Feliciano Idalia I
Purchase Details
Closed on
Jun 9, 1988
Sold by
Lot 10 Alicia Rd Tr
Bought by
Lin Carl M
Create a Home Valuation Report for This Property
The Home Valuation Report is an in-depth analysis detailing your home's value as well as a comparison with similar homes in the area
Home Values in the Area
Average Home Value in this Area
Purchase History
| Date | Buyer | Sale Price | Title Company |
|---|---|---|---|
| Michael And Kathy Ret | -- | None Available | |
| Michael And Kathy Ret | -- | None Available | |
| Chase Michael R | $235,000 | -- | |
| Feliciano Jose R | $130,000 | -- | |
| Feliciano Jose R | $130,000 | -- | |
| Lin Carl M | $188,900 | -- |
Source: Public Records
Mortgage History
| Date | Status | Borrower | Loan Amount |
|---|---|---|---|
| Previous Owner | Lin Carl M | $188,000 | |
| Previous Owner | Lin Carl M | $184,252 | |
| Previous Owner | Lin Carl M | $136,850 |
Source: Public Records
Tax History Compared to Growth
Tax History
| Year | Tax Paid | Tax Assessment Tax Assessment Total Assessment is a certain percentage of the fair market value that is determined by local assessors to be the total taxable value of land and additions on the property. | Land | Improvement |
|---|---|---|---|---|
| 2025 | $7,748 | $648,900 | $202,900 | $446,000 |
| 2024 | $7,059 | $566,500 | $180,400 | $386,100 |
| 2023 | $6,656 | $508,500 | $161,200 | $347,300 |
| 2022 | $6,341 | $461,500 | $146,200 | $315,300 |
| 2021 | $6,397 | $455,300 | $140,500 | $314,800 |
| 2020 | $6,369 | $425,200 | $122,500 | $302,700 |
| 2019 | $6,234 | $405,300 | $116,700 | $288,600 |
| 2018 | $6,066 | $371,700 | $108,600 | $263,100 |
| 2017 | $6,016 | $360,000 | $104,600 | $255,400 |
| 2016 | $5,725 | $329,400 | $98,900 | $230,500 |
| 2015 | $5,654 | $317,300 | $100,100 | $217,200 |
Source: Public Records
Map
Nearby Homes
- 37 Wilson Ave
- 53 Wilson Ave
- 848 Waverly St
- 8 Bellmore Rd
- 15 Bellmore Rd
- 45 Daytona Ave
- 818 Waverly St
- 51 Crest Rd
- 54 Vose St
- 26 Wilde Ave
- 6 B Harmony Ln Unit 2
- 39 Bethany Rd
- 8 Roberts Rd
- 12 & 14 Waverly St
- 34 Jodie Rd
- 131 Mellen St Unit 3B
- 327 Singletary Ln
- 181 E Union St
- 273 Singletary Ln
- 8 Cedar St