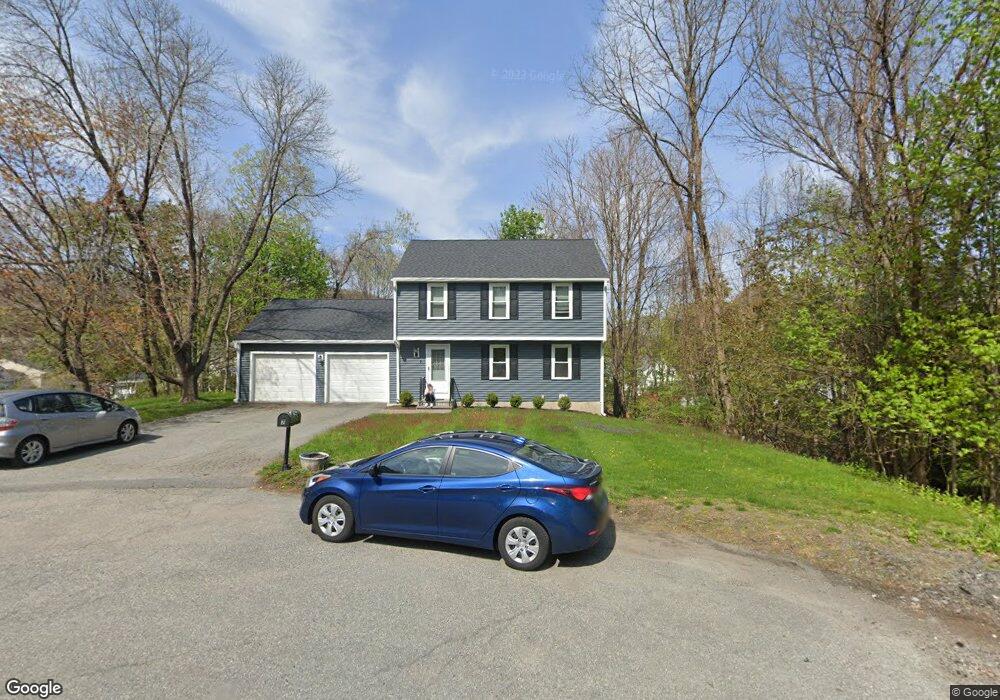
7 Allan Dr Maynard, MA 01754
Estimated Value: $657,000 - $715,000
3
Beds
2
Baths
1,692
Sq Ft
$400/Sq Ft
Est. Value
About This Home
This home is located at 7 Allan Dr, Maynard, MA 01754 and is currently estimated at $676,302, approximately $399 per square foot. 7 Allan Dr is a home located in Middlesex County with nearby schools including Green Meadow School, Fowler School, and Maynard High School.
Ownership History
Date
Name
Owned For
Owner Type
Purchase Details
Closed on
May 28, 2004
Sold by
Dontje Terry D
Bought by
Coleman Marlene E and Coleman Stephen M
Current Estimated Value
Home Financials for this Owner
Home Financials are based on the most recent Mortgage that was taken out on this home.
Original Mortgage
$307,600
Outstanding Balance
$149,155
Interest Rate
5.88%
Mortgage Type
Purchase Money Mortgage
Estimated Equity
$527,147
Purchase Details
Closed on
Aug 17, 1998
Sold by
Dawson Robert L and Dawson Margaret K
Bought by
Dontje Terry D and Dontje Julie A
Home Financials for this Owner
Home Financials are based on the most recent Mortgage that was taken out on this home.
Original Mortgage
$217,450
Interest Rate
6.94%
Mortgage Type
Purchase Money Mortgage
Create a Home Valuation Report for This Property
The Home Valuation Report is an in-depth analysis detailing your home's value as well as a comparison with similar homes in the area
Home Values in the Area
Average Home Value in this Area
Purchase History
| Date | Buyer | Sale Price | Title Company |
|---|---|---|---|
| Coleman Marlene E | $387,000 | -- | |
| Dontje Terry D | $229,000 | -- |
Source: Public Records
Mortgage History
| Date | Status | Borrower | Loan Amount |
|---|---|---|---|
| Open | Coleman Marlene E | $307,600 | |
| Previous Owner | Dontje Terry D | $191,200 | |
| Previous Owner | Dontje Terry D | $217,450 |
Source: Public Records
Tax History
| Year | Tax Paid | Tax Assessment Tax Assessment Total Assessment is a certain percentage of the fair market value that is determined by local assessors to be the total taxable value of land and additions on the property. | Land | Improvement |
|---|---|---|---|---|
| 2025 | $9,985 | $560,000 | $280,200 | $279,800 |
| 2024 | $9,383 | $524,800 | $266,900 | $257,900 |
| 2023 | $9,132 | $481,400 | $250,500 | $230,900 |
| 2022 | $8,709 | $424,400 | $218,100 | $206,300 |
| 2021 | $0 | $412,500 | $212,700 | $199,800 |
| 2020 | $8,535 | $413,500 | $207,300 | $206,200 |
| 2019 | $8,128 | $386,300 | $183,000 | $203,300 |
| 2018 | $0 | $358,600 | $160,900 | $197,700 |
| 2017 | $0 | $358,600 | $160,900 | $197,700 |
| 2016 | $7,620 | $358,600 | $160,900 | $197,700 |
| 2015 | $7,347 | $329,300 | $157,600 | $171,700 |
| 2014 | $7,104 | $318,700 | $150,600 | $168,100 |
Source: Public Records
Map
Nearby Homes
- 3 Apple Ridge Rd Unit 2
- 41 Taylor Rd
- 1 Apple Ridge Unit 2
- 74 Pompositticut St
- 154 Summer St
- 153 Summer St
- 6 Nancy Cir
- 38 Fairfield St
- 2 Bancroft St
- 34 Meeting House Ln Unit 114
- 9 Rice Rd
- 1 Walker St
- 8 Harrison St
- 2 Wall Ct
- 13 Arthur St Unit 15
- 5 Hayes St Unit 5
- 31-33 Roosevelt St
- 22 Douglas Ave Unit 2
- 22 Douglas Ave Unit 1
- 35 Roosevelt St Unit 37
Your Personal Tour Guide
Ask me questions while you tour the home.