7 Allara Ct Bear, DE 19701
Kirkwood NeighborhoodEstimated Value: $464,634 - $509,000
3
Beds
3
Baths
1,204
Sq Ft
$404/Sq Ft
Est. Value
About This Home
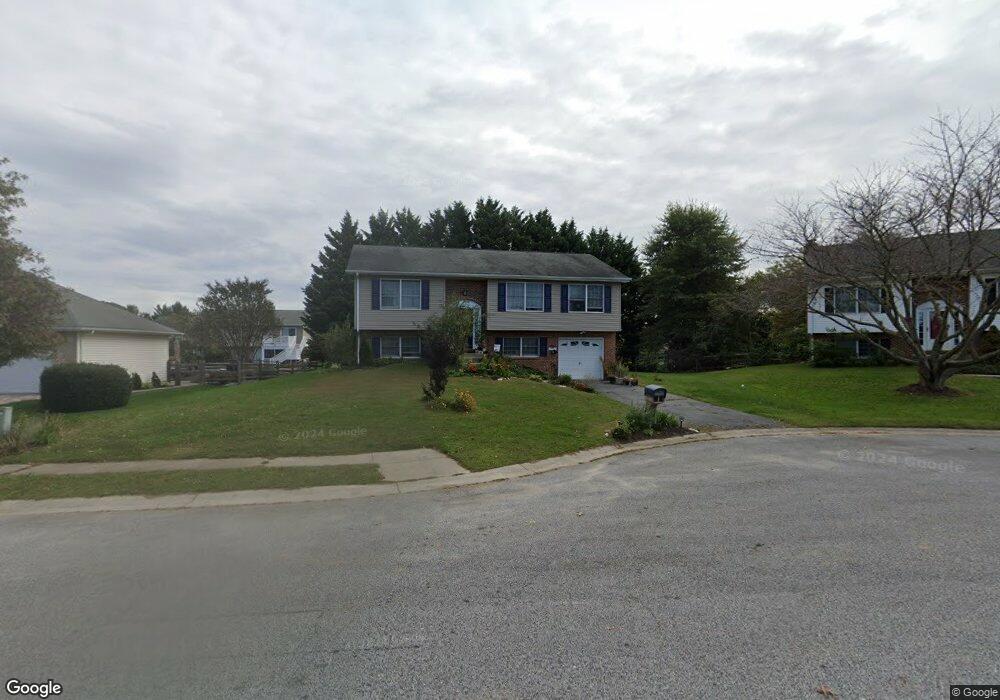
This home is located at 7 Allara Ct, Bear, DE 19701 and is currently estimated at $486,909, approximately $404 per square foot. 7 Allara Ct is a home located in New Castle County with nearby schools including Alfred G. Waters Middle School, Appoquinimink High School, and Glasgow Christian Academy.
Ownership History
Date
Name
Owned For
Owner Type
Purchase Details
Closed on
Aug 23, 2022
Sold by
Purnell Charles J
Bought by
Purnell Charles J and Crawford Kendra M
Current Estimated Value
Home Financials for this Owner
Home Financials are based on the most recent Mortgage that was taken out on this home.
Original Mortgage
$175,000
Outstanding Balance
$167,026
Interest Rate
5.3%
Mortgage Type
New Conventional
Estimated Equity
$319,883
Purchase Details
Closed on
Sep 26, 1997
Bought by
Purnell Charles J and Purnell Olivia G
Create a Home Valuation Report for This Property
The Home Valuation Report is an in-depth analysis detailing your home's value as well as a comparison with similar homes in the area
Home Values in the Area
Average Home Value in this Area
Purchase History
| Date | Buyer | Sale Price | Title Company |
|---|---|---|---|
| Purnell Charles J | -- | -- | |
| Purnell Charles J | $128,000 | -- |
Source: Public Records
Mortgage History
| Date | Status | Borrower | Loan Amount |
|---|---|---|---|
| Open | Purnell Charles J | $175,000 |
Source: Public Records
Tax History
| Year | Tax Paid | Tax Assessment Tax Assessment Total Assessment is a certain percentage of the fair market value that is determined by local assessors to be the total taxable value of land and additions on the property. | Land | Improvement |
|---|---|---|---|---|
| 2024 | $2,921 | $67,500 | $12,000 | $55,500 |
| 2023 | $2,505 | $67,500 | $12,000 | $55,500 |
| 2022 | $2,512 | $67,500 | $12,000 | $55,500 |
| 2021 | $2,481 | $67,500 | $12,000 | $55,500 |
| 2020 | $2,454 | $67,500 | $12,000 | $55,500 |
| 2019 | $2,485 | $67,500 | $12,000 | $55,500 |
| 2018 | $2,205 | $67,500 | $12,000 | $55,500 |
| 2017 | $2,116 | $67,500 | $12,000 | $55,500 |
| 2016 | $1,926 | $67,500 | $12,000 | $55,500 |
| 2015 | $1,875 | $67,500 | $12,000 | $55,500 |
| 2014 | $1,881 | $67,500 | $12,000 | $55,500 |
Source: Public Records
Map
Nearby Homes
- 48 Marble House Dr
- 557 Mansion House Rd
- 15 Eaton Place
- 2 Pegasus Place
- 152 W Savannah Dr
- 5 Worthy Down Ave
- 52 Eaton Place
- 45 Longleaf Ln
- 7 Keeneland Ct
- 25 Shawn Ln
- 2664 Glasgow Ave
- 235 Hope Ct W
- 204 Springwood Dr
- 222 Springwood Dr
- 523 Ponderosa Dr
- 1 Bohemia Rd
- 4 Riva Ridge Ln
- 18 Devalinder Dr
- 325 Howell School Rd
- 121 Devalinder Dr
Your Personal Tour Guide
Ask me questions while you tour the home.