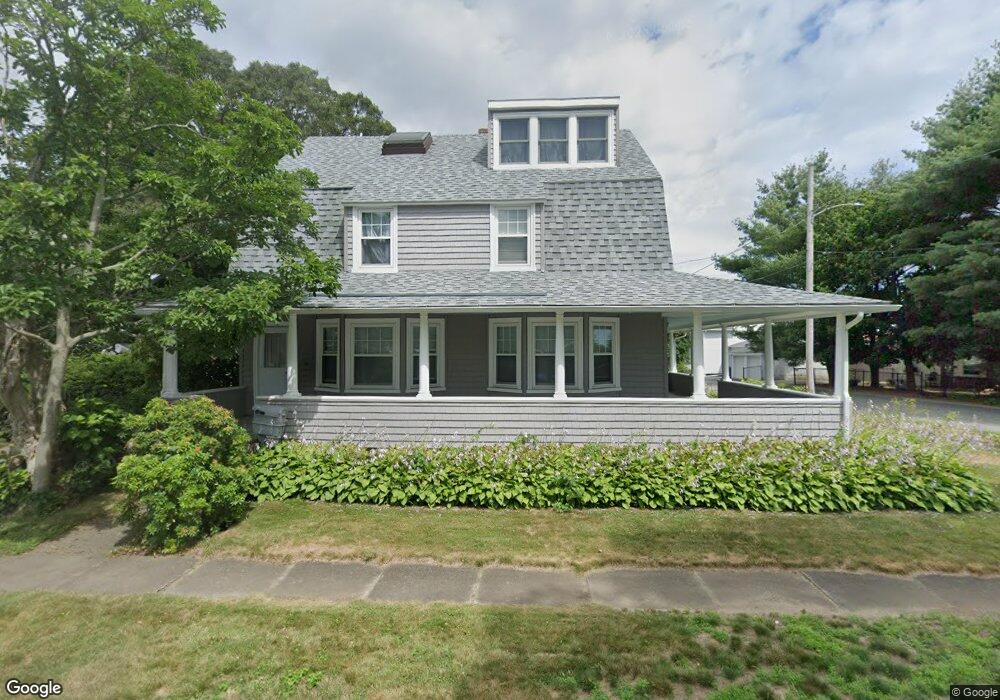
7 Allard St Warwick, RI 02889
Conimicut-Shawomet NeighborhoodEstimated Value: $495,000 - $593,264
3
Beds
3
Baths
2,445
Sq Ft
$220/Sq Ft
Est. Value
About This Home
This home is located at 7 Allard St, Warwick, RI 02889 and is currently estimated at $537,816, approximately $219 per square foot. 7 Allard St is a home located in Kent County with nearby schools including Saint Kevin School and Bishop Hendricken High School.
Ownership History
Date
Name
Owned For
Owner Type
Purchase Details
Closed on
Jan 19, 2024
Sold by
Fear Jeffrey E
Bought by
Jeffrey E F Fear Ret and Fear
Current Estimated Value
Purchase Details
Closed on
Sep 17, 2012
Sold by
Fear Jeffrey E
Bought by
Fear Jeffrey E
Purchase Details
Closed on
Sep 30, 1994
Sold by
Mahoney Joan A
Bought by
Fear Jeffrey E and Fear Laurie
Create a Home Valuation Report for This Property
The Home Valuation Report is an in-depth analysis detailing your home's value as well as a comparison with similar homes in the area
Home Values in the Area
Average Home Value in this Area
Purchase History
| Date | Buyer | Sale Price | Title Company |
|---|---|---|---|
| Jeffrey E F Fear Ret | -- | None Available | |
| Fear Jeffrey E | -- | -- | |
| Fear Jeffrey E | $119,000 | -- |
Source: Public Records
Mortgage History
| Date | Status | Borrower | Loan Amount |
|---|---|---|---|
| Previous Owner | Fear Jeffrey E | $121,500 | |
| Previous Owner | Fear Jeffrey E | $145,000 | |
| Previous Owner | Fear Jeffrey E | $145,000 | |
| Previous Owner | Fear Jeffrey E | $103,600 |
Source: Public Records
Tax History
| Year | Tax Paid | Tax Assessment Tax Assessment Total Assessment is a certain percentage of the fair market value that is determined by local assessors to be the total taxable value of land and additions on the property. | Land | Improvement |
|---|---|---|---|---|
| 2025 | $6,826 | $537,500 | $172,400 | $365,100 |
| 2024 | $6,115 | $422,600 | $150,000 | $272,600 |
| 2023 | $5,997 | $422,600 | $150,000 | $272,600 |
| 2022 | $5,713 | $305,000 | $96,200 | $208,800 |
| 2021 | $5,713 | $305,000 | $96,200 | $208,800 |
| 2020 | $5,713 | $305,000 | $96,200 | $208,800 |
| 2019 | $5,713 | $305,000 | $96,200 | $208,800 |
| 2018 | $5,601 | $269,300 | $96,200 | $173,100 |
| 2017 | $5,451 | $269,300 | $96,200 | $173,100 |
| 2016 | $5,679 | $280,600 | $96,200 | $184,400 |
| 2015 | $5,302 | $255,500 | $64,200 | $191,300 |
| 2014 | $5,125 | $255,500 | $64,200 | $191,300 |
| 2013 | $5,056 | $255,500 | $64,200 | $191,300 |
Source: Public Records
Map
Nearby Homes
Your Personal Tour Guide
Ask me questions while you tour the home.