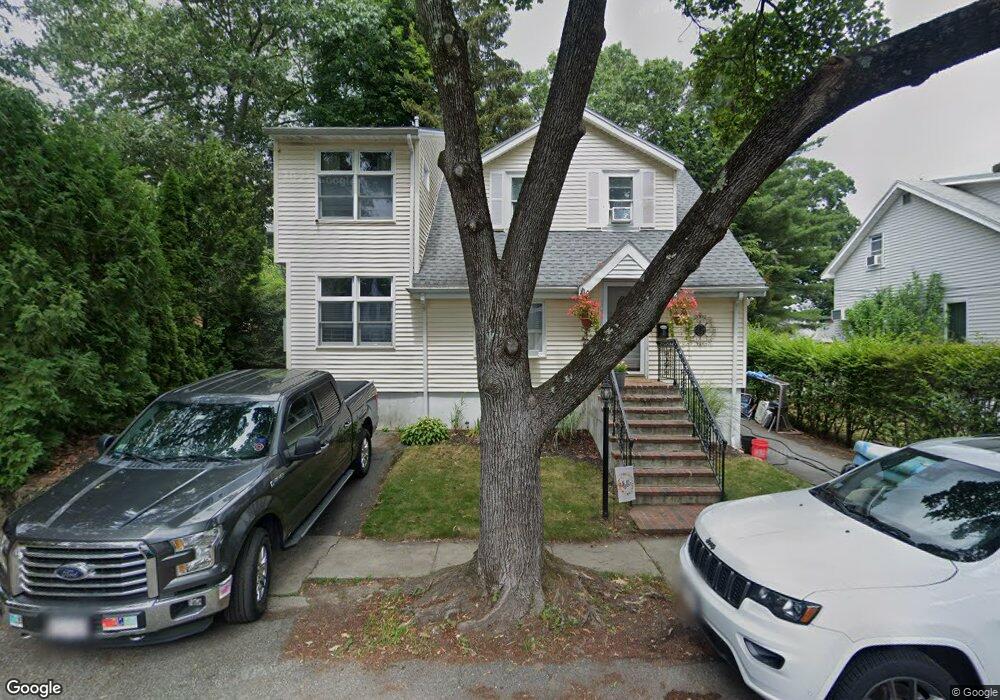
7 Allison Rd Saugus, MA 01906
Cliftondale NeighborhoodEstimated Value: $675,593 - $711,000
4
Beds
2
Baths
1,745
Sq Ft
$396/Sq Ft
Est. Value
About This Home
This home is located at 7 Allison Rd, Saugus, MA 01906 and is currently estimated at $690,648, approximately $395 per square foot. 7 Allison Rd is a home located in Essex County with nearby schools including Saugus High School and Pioneer Charter School Of Science II.
Ownership History
Date
Name
Owned For
Owner Type
Purchase Details
Closed on
Jun 21, 1996
Sold by
Tabbi Paul B and Tabbi Lisa M
Bought by
Wright Stephen M and Wright Margaret
Current Estimated Value
Home Financials for this Owner
Home Financials are based on the most recent Mortgage that was taken out on this home.
Original Mortgage
$124,200
Outstanding Balance
$8,087
Interest Rate
8.21%
Mortgage Type
Purchase Money Mortgage
Estimated Equity
$682,561
Purchase Details
Closed on
Apr 19, 1990
Sold by
Martinez Jose
Bought by
Tabbi Paul B
Home Financials for this Owner
Home Financials are based on the most recent Mortgage that was taken out on this home.
Original Mortgage
$100,000
Interest Rate
10.21%
Mortgage Type
Purchase Money Mortgage
Create a Home Valuation Report for This Property
The Home Valuation Report is an in-depth analysis detailing your home's value as well as a comparison with similar homes in the area
Home Values in the Area
Average Home Value in this Area
Purchase History
| Date | Buyer | Sale Price | Title Company |
|---|---|---|---|
| Wright Stephen M | $138,000 | -- | |
| Tabbi Paul B | $155,000 | -- |
Source: Public Records
Mortgage History
| Date | Status | Borrower | Loan Amount |
|---|---|---|---|
| Open | Tabbi Paul B | $124,200 | |
| Previous Owner | Tabbi Paul B | $100,000 | |
| Previous Owner | Tabbi Paul B | $100,000 |
Source: Public Records
Tax History
| Year | Tax Paid | Tax Assessment Tax Assessment Total Assessment is a certain percentage of the fair market value that is determined by local assessors to be the total taxable value of land and additions on the property. | Land | Improvement |
|---|---|---|---|---|
| 2025 | $6,211 | $581,600 | $309,600 | $272,000 |
| 2024 | $5,950 | $558,700 | $291,900 | $266,800 |
| 2023 | $5,759 | $511,500 | $256,500 | $255,000 |
| 2022 | $5,575 | $464,200 | $235,300 | $228,900 |
| 2021 | $5,248 | $425,300 | $204,300 | $221,000 |
| 2020 | $4,854 | $407,200 | $194,600 | $212,600 |
| 2019 | $4,670 | $383,400 | $176,900 | $206,500 |
| 2018 | $4,202 | $362,900 | $171,600 | $191,300 |
| 2017 | $3,915 | $324,900 | $160,100 | $164,800 |
| 2016 | $3,548 | $290,800 | $159,900 | $130,900 |
| 2015 | $3,328 | $276,900 | $152,200 | $124,700 |
| 2014 | $3,246 | $279,600 | $152,200 | $127,400 |
Source: Public Records
Map
Nearby Homes
- 31 Mountain Ave
- 20 Maple St
- 4 Foss Ave
- 141 Essex St Unit D6
- 141 Essex St Unit B4
- 32-34 Mount Vernon St
- 7 Adams Ave
- 2 Ashford St
- 6 Saugus Ave Unit A
- 25 Auburn St
- 57 Vine St
- 36 Jasper St
- 28 Naples Ave
- 62 Main St
- 25 Piedmont Ave
- 133 Salem St Unit 414
- 187 Hamilton St
- 0 Hampton St
- 4 Oneil Way
- 44 Ballard St
Your Personal Tour Guide
Ask me questions while you tour the home.