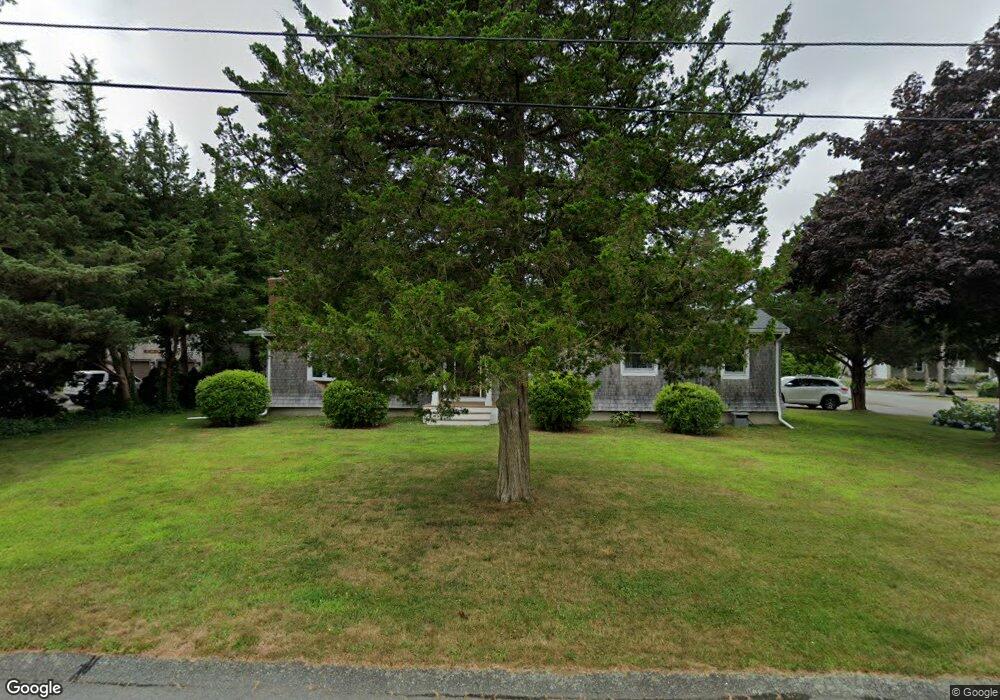
7 Andrea Rd Pocasset, MA 02559
Pocasset NeighborhoodEstimated Value: $730,000 - $878,000
3
Beds
2
Baths
1,388
Sq Ft
$580/Sq Ft
Est. Value
About This Home
This home is located at 7 Andrea Rd, Pocasset, MA 02559 and is currently estimated at $805,436, approximately $580 per square foot. 7 Andrea Rd is a home located in Barnstable County with nearby schools including Bourne High School and Cadence Academy Preschool - Bourne.
Ownership History
Date
Name
Owned For
Owner Type
Purchase Details
Closed on
May 11, 2009
Sold by
Breen Kevin J and Breen Dana S
Bought by
Tarantino Anthony P
Current Estimated Value
Home Financials for this Owner
Home Financials are based on the most recent Mortgage that was taken out on this home.
Original Mortgage
$272,000
Outstanding Balance
$170,835
Interest Rate
4.9%
Mortgage Type
Purchase Money Mortgage
Estimated Equity
$634,601
Purchase Details
Closed on
May 4, 2005
Sold by
Antonellis Philomena
Bought by
Breen Dana S and Breen Kevin J
Home Financials for this Owner
Home Financials are based on the most recent Mortgage that was taken out on this home.
Original Mortgage
$200,000
Interest Rate
6.01%
Mortgage Type
Purchase Money Mortgage
Purchase Details
Closed on
Jun 14, 2004
Sold by
Antonellis Filomena and Antonellis Philomena
Bought by
Antonellis Philomena
Create a Home Valuation Report for This Property
The Home Valuation Report is an in-depth analysis detailing your home's value as well as a comparison with similar homes in the area
Home Values in the Area
Average Home Value in this Area
Purchase History
| Date | Buyer | Sale Price | Title Company |
|---|---|---|---|
| Tarantino Anthony P | $340,000 | -- | |
| Tarantino Anthony P | $340,000 | -- | |
| Breen Dana S | $375,500 | -- | |
| Breen Dana S | $375,500 | -- | |
| Antonellis Philomena | -- | -- | |
| Antonellis Philomena | -- | -- |
Source: Public Records
Mortgage History
| Date | Status | Borrower | Loan Amount |
|---|---|---|---|
| Open | Tarantino Anthony P | $272,000 | |
| Closed | Antonellis Philomena | $272,000 | |
| Previous Owner | Breen Dana S | $200,000 |
Source: Public Records
Tax History Compared to Growth
Tax History
| Year | Tax Paid | Tax Assessment Tax Assessment Total Assessment is a certain percentage of the fair market value that is determined by local assessors to be the total taxable value of land and additions on the property. | Land | Improvement |
|---|---|---|---|---|
| 2025 | $5,162 | $660,900 | $334,000 | $326,900 |
| 2024 | $5,046 | $629,200 | $318,000 | $311,200 |
| 2023 | $4,700 | $533,500 | $258,000 | $275,500 |
| 2022 | $4,511 | $447,100 | $228,300 | $218,800 |
| 2021 | $4,384 | $407,100 | $207,800 | $199,300 |
| 2020 | $4,257 | $396,400 | $205,800 | $190,600 |
| 2019 | $4,078 | $388,000 | $205,800 | $182,200 |
| 2018 | $3,764 | $357,100 | $196,100 | $161,000 |
| 2017 | $3,829 | $371,700 | $194,200 | $177,500 |
| 2016 | $3,146 | $309,600 | $170,700 | $138,900 |
| 2015 | $3,118 | $309,600 | $170,700 | $138,900 |
Source: Public Records
Map
Nearby Homes
- 171 Bellavista Dr
- 34 Kenwood Rd
- 45 Kenwood Rd
- 70 Wings Neck Rd
- 24 Richmond Rd
- 254 Barlows Landing Rd
- 22 Nairn Rd
- 14 Navajo Rd
- 89 Harbor Dr
- 940 County Rd
- 709 County Rd
- 48 Red Brook Harbor Rd
- 174 Barlows Landing Rd
- 3 Red Brook Pond Dr
- 39 Bennets Neck Dr
- 1094 County Rd
- 7 4th Ave
- 940 County Rd
- 15 1st St
- 515 County Rd