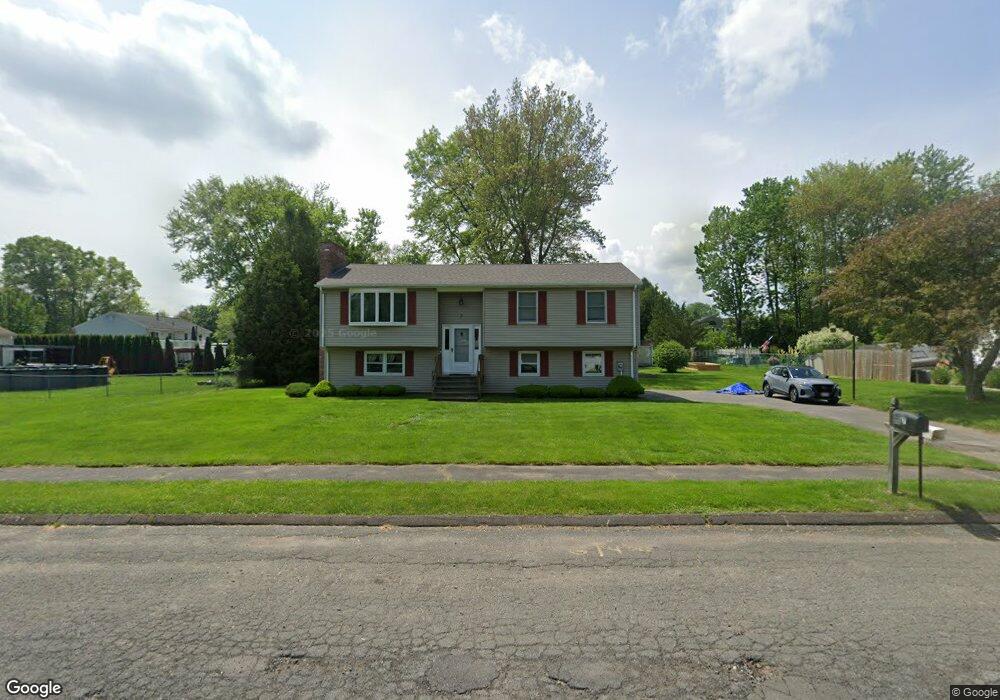
7 Beech Ln Feeding Hills, MA 01030
Estimated Value: $311,000 - $417,000
3
Beds
2
Baths
1,144
Sq Ft
$324/Sq Ft
Est. Value
About This Home
This home is located at 7 Beech Ln, Feeding Hills, MA 01030 and is currently estimated at $370,209, approximately $323 per square foot. 7 Beech Ln is a home located in Hampden County with nearby schools including Agawam Junior High School and Agawam High School.
Ownership History
Date
Name
Owned For
Owner Type
Purchase Details
Closed on
Oct 28, 2024
Sold by
Choiniere John M
Bought by
Scala Frank V
Current Estimated Value
Home Financials for this Owner
Home Financials are based on the most recent Mortgage that was taken out on this home.
Original Mortgage
$311,000
Outstanding Balance
$307,950
Interest Rate
6.2%
Mortgage Type
Purchase Money Mortgage
Estimated Equity
$62,259
Purchase Details
Closed on
Jul 15, 1994
Sold by
Obrien Gary F and Obrien Patricia A
Bought by
Choiniere John M
Home Financials for this Owner
Home Financials are based on the most recent Mortgage that was taken out on this home.
Original Mortgage
$70,000
Interest Rate
8.51%
Mortgage Type
Purchase Money Mortgage
Create a Home Valuation Report for This Property
The Home Valuation Report is an in-depth analysis detailing your home's value as well as a comparison with similar homes in the area
Home Values in the Area
Average Home Value in this Area
Purchase History
| Date | Buyer | Sale Price | Title Company |
|---|---|---|---|
| Scala Frank V | $331,500 | None Available | |
| Scala Frank V | $331,500 | None Available | |
| Choiniere John M | $129,000 | -- | |
| Choiniere John M | $129,000 | -- |
Source: Public Records
Mortgage History
| Date | Status | Borrower | Loan Amount |
|---|---|---|---|
| Open | Scala Frank V | $311,000 | |
| Closed | Scala Frank V | $311,000 | |
| Previous Owner | Choiniere John M | $63,000 | |
| Previous Owner | Choiniere John M | $70,000 | |
| Previous Owner | Choiniere John M | $24,000 |
Source: Public Records
Tax History Compared to Growth
Tax History
| Year | Tax Paid | Tax Assessment Tax Assessment Total Assessment is a certain percentage of the fair market value that is determined by local assessors to be the total taxable value of land and additions on the property. | Land | Improvement |
|---|---|---|---|---|
| 2025 | $4,698 | $320,900 | $130,200 | $190,700 |
| 2024 | $4,614 | $317,300 | $130,200 | $187,100 |
| 2023 | $4,276 | $271,000 | $117,600 | $153,400 |
| 2022 | $4,255 | $264,100 | $117,600 | $146,500 |
| 2021 | $3,995 | $237,800 | $100,100 | $137,700 |
| 2020 | $3,957 | $235,100 | $98,100 | $137,000 |
| 2019 | $3,726 | $223,800 | $95,300 | $128,500 |
| 2018 | $3,566 | $214,700 | $95,300 | $119,400 |
| 2017 | $3,425 | $210,000 | $95,300 | $114,700 |
| 2016 | $3,314 | $204,800 | $95,300 | $109,500 |
| 2015 | $3,290 | $209,000 | $95,300 | $113,700 |
Source: Public Records
Map
Nearby Homes
- 122 Southwick St
- 387 Southwick St
- 36-38 Orlando St
- 200 Anvil St
- 50 Muriel Ln
- 550 Southwick St
- 92 Juniper Ridge Dr
- 157 Cambridge St
- 60 Elizabeth St
- 4 Liquori Dr
- 306 Feeding Hills Rd
- 999 N Street Extension
- 1085 N Street Extension
- 215 Barry St
- 511 Shoemaker Ln
- 141 Barry St
- 691 Mill St
- 7 Agnoli Place
- 67 Colemore St
- 94 Witheridge St