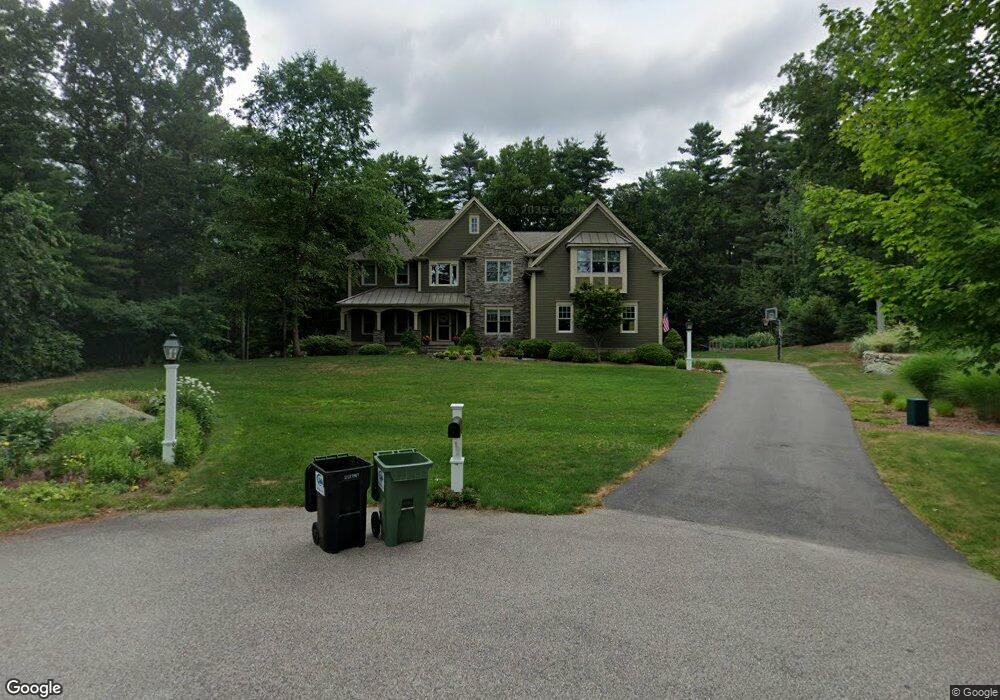
7 Bristol Ln Foxboro, MA 02035
Estimated Value: $1,209,000 - $1,417,211
4
Beds
4
Baths
4,100
Sq Ft
$322/Sq Ft
Est. Value
About This Home
This home is located at 7 Bristol Ln, Foxboro, MA 02035 and is currently estimated at $1,320,303, approximately $322 per square foot. 7 Bristol Ln is a home located in Norfolk County with nearby schools including Foxborough High School, Foxborough Regional Charter School, and Hands-On-Montessori School.
Ownership History
Date
Name
Owned For
Owner Type
Purchase Details
Closed on
Jun 2, 2009
Sold by
Winterton Corp
Bought by
Lynch Joseph D and Lynch Lisa S
Current Estimated Value
Home Financials for this Owner
Home Financials are based on the most recent Mortgage that was taken out on this home.
Original Mortgage
$385,000
Outstanding Balance
$244,557
Interest Rate
4.87%
Mortgage Type
Purchase Money Mortgage
Estimated Equity
$1,075,746
Create a Home Valuation Report for This Property
The Home Valuation Report is an in-depth analysis detailing your home's value as well as a comparison with similar homes in the area
Home Values in the Area
Average Home Value in this Area
Purchase History
| Date | Buyer | Sale Price | Title Company |
|---|---|---|---|
| Lynch Joseph D | -- | -- |
Source: Public Records
Mortgage History
| Date | Status | Borrower | Loan Amount |
|---|---|---|---|
| Open | Lynch Joseph D | $385,000 |
Source: Public Records
Tax History Compared to Growth
Tax History
| Year | Tax Paid | Tax Assessment Tax Assessment Total Assessment is a certain percentage of the fair market value that is determined by local assessors to be the total taxable value of land and additions on the property. | Land | Improvement |
|---|---|---|---|---|
| 2025 | $15,376 | $1,163,100 | $396,300 | $766,800 |
| 2024 | $14,712 | $1,089,000 | $357,900 | $731,100 |
| 2023 | $14,241 | $1,002,200 | $365,300 | $636,900 |
| 2022 | $13,649 | $940,000 | $339,000 | $601,000 |
| 2021 | $13,861 | $940,400 | $349,600 | $590,800 |
| 2020 | $13,412 | $920,500 | $349,600 | $570,900 |
| 2019 | $12,123 | $824,700 | $282,500 | $542,200 |
| 2018 | $11,794 | $809,500 | $282,500 | $527,000 |
| 2017 | $11,351 | $754,700 | $263,900 | $490,800 |
| 2016 | $11,789 | $795,500 | $300,800 | $494,700 |
| 2015 | $11,876 | $781,800 | $261,500 | $520,300 |
| 2014 | $11,566 | $771,600 | $261,500 | $510,100 |
Source: Public Records
Map
Nearby Homes
- 80 Mill St
- 12 West St
- 84 South St
- 8 Howard Ave
- 3 Bassett St
- 483 Thurston St
- 14 Baker St
- 16 Bradner St
- 194 Central St
- 115 S High St
- 11 Goodwin Dr
- 8 Conway Ln
- 5 Post Rd
- 39 Mechanic St Unit A
- 132 S High St
- 84 Cocasset St Unit A6
- 11 W Belcher Rd Unit 5
- 19 Fuller Rd Unit 7
- 16 Treasure Island Rd
- 356 Central St