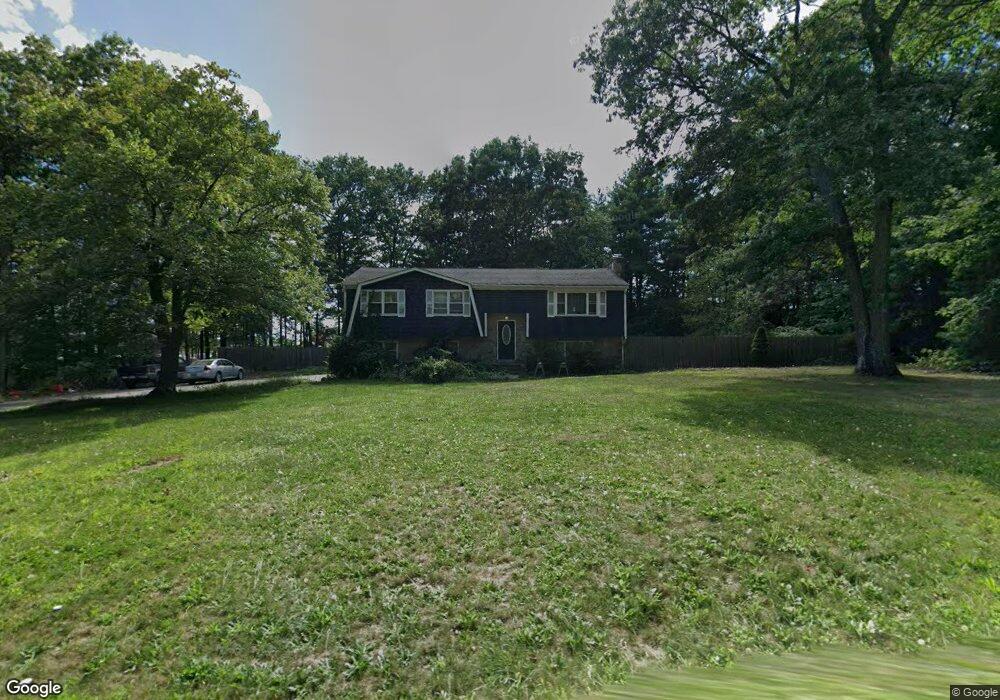
7 Bryant St Assonet, MA 02702
Estimated Value: $556,000 - $633,000
3
Beds
2
Baths
1,344
Sq Ft
$439/Sq Ft
Est. Value
About This Home
This home is located at 7 Bryant St, Assonet, MA 02702 and is currently estimated at $589,680, approximately $438 per square foot. 7 Bryant St is a home located in Bristol County with nearby schools including George R Austin Intermediate School, Freetown-Lakeville Middle School, and Apponequet Regional High School.
Ownership History
Date
Name
Owned For
Owner Type
Purchase Details
Closed on
Jul 10, 2008
Sold by
Halstead Barbara E and Halstead John V
Bought by
Olivia Grace Llc
Current Estimated Value
Purchase Details
Closed on
Dec 30, 2004
Sold by
Swansea Rlty Corp
Bought by
Halstead Barbra E and Halstead John
Home Financials for this Owner
Home Financials are based on the most recent Mortgage that was taken out on this home.
Original Mortgage
$292,500
Interest Rate
5.73%
Mortgage Type
Purchase Money Mortgage
Purchase Details
Closed on
Jan 9, 2004
Sold by
Eqcc Home Equity Loan
Bought by
Swansea Realty Corp and Ti Realty Inc
Home Financials for this Owner
Home Financials are based on the most recent Mortgage that was taken out on this home.
Original Mortgage
$210,000
Interest Rate
5.88%
Mortgage Type
Purchase Money Mortgage
Create a Home Valuation Report for This Property
The Home Valuation Report is an in-depth analysis detailing your home's value as well as a comparison with similar homes in the area
Home Values in the Area
Average Home Value in this Area
Purchase History
| Date | Buyer | Sale Price | Title Company |
|---|---|---|---|
| Olivia Grace Llc | $315,000 | -- | |
| Halstead Barbra E | $325,000 | -- | |
| Swansea Realty Corp | $236,500 | -- |
Source: Public Records
Mortgage History
| Date | Status | Borrower | Loan Amount |
|---|---|---|---|
| Previous Owner | Swansea Realty Corp | $292,500 | |
| Previous Owner | Swansea Realty Corp | $210,000 | |
| Previous Owner | Swansea Realty Corp | $62,000 |
Source: Public Records
Tax History Compared to Growth
Tax History
| Year | Tax Paid | Tax Assessment Tax Assessment Total Assessment is a certain percentage of the fair market value that is determined by local assessors to be the total taxable value of land and additions on the property. | Land | Improvement |
|---|---|---|---|---|
| 2025 | $4,712 | $475,500 | $180,300 | $295,200 |
| 2024 | $4,719 | $452,400 | $170,000 | $282,400 |
| 2023 | $4,575 | $427,200 | $153,100 | $274,100 |
| 2022 | $4,397 | $364,600 | $129,700 | $234,900 |
| 2021 | $4,219 | $332,200 | $118,000 | $214,200 |
| 2020 | $4,187 | $321,600 | $113,500 | $208,100 |
| 2019 | $3,987 | $303,200 | $108,000 | $195,200 |
| 2018 | $3,767 | $283,000 | $108,000 | $175,000 |
| 2017 | $3,663 | $275,000 | $108,000 | $167,000 |
| 2016 | $3,413 | $260,700 | $104,900 | $155,800 |
| 2015 | $3,324 | $257,700 | $104,900 | $152,800 |
| 2014 | $3,098 | $245,700 | $102,800 | $142,900 |
Source: Public Records
Map
Nearby Homes
- 15 Leonard Ave
- 52 Anthony St
- 6 Weetamoe Dr
- 95 Howland Rd
- 1 Great Cedar Dr
- 165 Padelford St
- 7 Great Cedar Crossing
- 20 Slab Bridge Rd
- 59 Seymour St
- 1 Elm St
- 5 Hadley Heights Way
- 37 Simpson Ln
- 16 Water St Unit A
- 16 Water St Unit C
- 16 Water St Unit B
- 16 Water St Unit D
- 4 Hadley Heights Way
- 66 S Main St
- 22 Freemens Cir
- 14 Alberta Ln
- 179 Bryant St
- 6 Bryant St
- 188 Bryant St
- 5 Bryant St
- 186 Bryant St
- 186 Bryant St
- 186 Bryant St
- 2 Bryant St Unit A
- 2 Bryant St Unit B
- 2 Bryant St Unit C
- 2 Bryant St Unit D
- 2 Bryant St Unit E
- 2 Bryant St Unit G
- 2 Bryant St Unit H
- 2 Bryant St Unit J
- 2 Bryant St
- 3 Bryant St
- 184 Bryant St
- 2 Bryant St
- 2 Bryant St Unit G