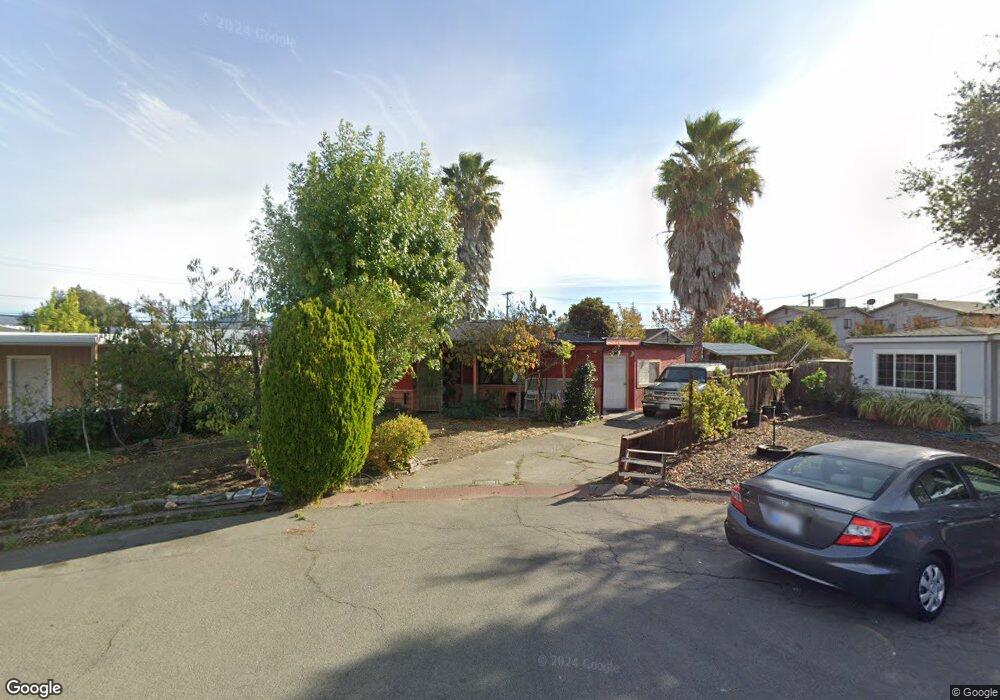
7 Burnette Ct Napa, CA 94558
Pueblo Park NeighborhoodEstimated Value: $617,662 - $667,000
3
Beds
1
Bath
1,106
Sq Ft
$574/Sq Ft
Est. Value
About This Home
This home is located at 7 Burnette Ct, Napa, CA 94558 and is currently estimated at $634,916, approximately $574 per square foot. 7 Burnette Ct is a home located in Napa County with nearby schools including West Park Elementary School, Redwood Middle School, and Vintage High School.
Ownership History
Date
Name
Owned For
Owner Type
Purchase Details
Closed on
Aug 25, 2005
Sold by
Sanchez Martha
Bought by
Sanchez Abelino
Current Estimated Value
Home Financials for this Owner
Home Financials are based on the most recent Mortgage that was taken out on this home.
Original Mortgage
$136,000
Interest Rate
5.61%
Mortgage Type
Fannie Mae Freddie Mac
Purchase Details
Closed on
Aug 15, 2005
Sold by
Sanchez Antonio
Bought by
Sanchez Abelino
Home Financials for this Owner
Home Financials are based on the most recent Mortgage that was taken out on this home.
Original Mortgage
$136,000
Interest Rate
5.61%
Mortgage Type
Fannie Mae Freddie Mac
Purchase Details
Closed on
Jan 14, 1998
Sold by
Slimp June W 1991 Revocable Inter Vivos and Slimp Karen
Bought by
Sanchez Abelino and Sanchez Antonio
Home Financials for this Owner
Home Financials are based on the most recent Mortgage that was taken out on this home.
Original Mortgage
$141,323
Interest Rate
7.05%
Mortgage Type
FHA
Create a Home Valuation Report for This Property
The Home Valuation Report is an in-depth analysis detailing your home's value as well as a comparison with similar homes in the area
Home Values in the Area
Average Home Value in this Area
Purchase History
| Date | Buyer | Sale Price | Title Company |
|---|---|---|---|
| Sanchez Abelino | -- | Placer Title Company | |
| Sanchez Abelino | $68,000 | -- | |
| Sanchez Abelino | $143,181 | Chicago Title Co |
Source: Public Records
Mortgage History
| Date | Status | Borrower | Loan Amount |
|---|---|---|---|
| Closed | Sanchez Abelino | $136,000 | |
| Previous Owner | Sanchez Abelino | $141,323 |
Source: Public Records
Tax History
| Year | Tax Paid | Tax Assessment Tax Assessment Total Assessment is a certain percentage of the fair market value that is determined by local assessors to be the total taxable value of land and additions on the property. | Land | Improvement |
|---|---|---|---|---|
| 2025 | $3,376 | $228,594 | $119,741 | $108,853 |
| 2024 | $3,284 | $224,113 | $117,394 | $106,719 |
| 2023 | $3,284 | $219,720 | $115,093 | $104,627 |
| 2022 | $3,201 | $215,413 | $112,837 | $102,576 |
| 2021 | $3,162 | $211,190 | $110,625 | $100,565 |
| 2020 | $3,141 | $209,025 | $109,491 | $99,534 |
| 2019 | $3,068 | $204,928 | $107,345 | $97,583 |
| 2018 | $3,012 | $200,911 | $105,241 | $95,670 |
| 2017 | $2,935 | $196,973 | $103,178 | $93,795 |
| 2016 | $2,834 | $193,111 | $101,155 | $91,956 |
| 2015 | $2,631 | $190,211 | $99,636 | $90,575 |
| 2014 | $2,587 | $186,486 | $97,685 | $88,801 |
Source: Public Records
Map
Nearby Homes
- 14 Margo Ct
- 2195 Delpha Dr
- 1596 Verna Dr
- 1131 La Pintura Ln
- 2089 W Park Ave
- 2172 Kathleen Dr
- 2133 Redwood Rd
- 1350 Pueblo Ave Unit 346
- 15 Lemon Ct
- 2312 Kathleen Dr
- 2300 W Park Ave
- 2313 Roberto St
- 3130 Jefferson St Unit 54
- 2470 W Pueblo Ave
- 3538 Baxter Ave
- 3273 Macfadden St
- 2389 Chad Ct
- 3612 Idlewild Ave
- 2325 Georgia St
- 2031 Lee Ave
- 9 Burnette Ct
- 3 Burnette Ct
- 3083 Solano Ave
- 3069 Solano Ave
- 3031 Solano Ave
- 1 Burnette Ct
- 15 Burnette Ct
- 2010 W Pueblo Ave
- 19 Burnette Ct
- 2014 W Pueblo Ave
- 25 Burnette Ct
- 2024 W Pueblo Ave
- 5 Geraldine Ct
- 3 Geraldine Ct
- 2035 Delpha Dr
- 2006 W Pueblo Ave
- 2022 W Pueblo Ave
- 2016 W Pueblo Ave
- 9 Geraldine Ct
Your Personal Tour Guide
Ask me questions while you tour the home.