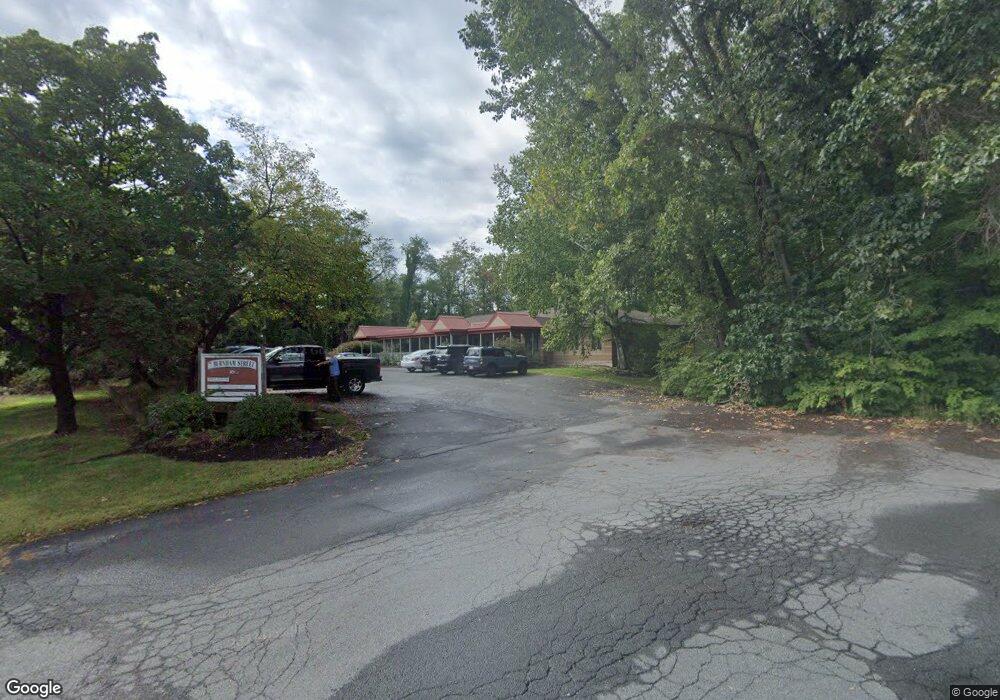
7 Burnham St Montague, MA 01376
Estimated Value: $1,042,594
--
Bed
1
Bath
1,156
Sq Ft
$902/Sq Ft
Est. Value
About This Home
This home is located at 7 Burnham St, Montague, MA 01376 and is currently estimated at $1,042,594, approximately $901 per square foot. 7 Burnham St is a home located in Franklin County.
Ownership History
Date
Name
Owned For
Owner Type
Purchase Details
Closed on
Jan 10, 2017
Sold by
Andreas James A
Bought by
Collura Realty Llc
Current Estimated Value
Home Financials for this Owner
Home Financials are based on the most recent Mortgage that was taken out on this home.
Original Mortgage
$468,000
Outstanding Balance
$382,776
Interest Rate
4.03%
Mortgage Type
Commercial
Estimated Equity
$659,818
Create a Home Valuation Report for This Property
The Home Valuation Report is an in-depth analysis detailing your home's value as well as a comparison with similar homes in the area
Home Values in the Area
Average Home Value in this Area
Purchase History
| Date | Buyer | Sale Price | Title Company |
|---|---|---|---|
| Collura Realty Llc | $585,000 | -- | |
| Collura Realty Llc | $585,000 | -- |
Source: Public Records
Mortgage History
| Date | Status | Borrower | Loan Amount |
|---|---|---|---|
| Open | Collura Realty Llc | $468,000 | |
| Closed | Collura Realty Llc | $468,000 |
Source: Public Records
Tax History Compared to Growth
Tax History
| Year | Tax Paid | Tax Assessment Tax Assessment Total Assessment is a certain percentage of the fair market value that is determined by local assessors to be the total taxable value of land and additions on the property. | Land | Improvement |
|---|---|---|---|---|
| 2025 | $12,669 | $522,200 | $51,100 | $471,100 |
| 2024 | $10,749 | $447,700 | $51,100 | $396,600 |
| 2023 | $10,568 | $444,400 | $51,100 | $393,300 |
| 2022 | $11,479 | $444,400 | $51,100 | $393,300 |
| 2021 | $13,212 | $489,500 | $51,100 | $438,400 |
| 2020 | $362 | $489,400 | $51,100 | $438,300 |
| 2019 | $12,354 | $471,700 | $51,100 | $420,600 |
| 2018 | $373 | $442,700 | $51,100 | $391,600 |
| 2017 | $94 | $442,700 | $51,100 | $391,600 |
| 2016 | $11,298 | $429,600 | $51,100 | $378,500 |
| 2015 | $11,019 | $429,600 | $51,100 | $378,500 |
| 2014 | $10,676 | $429,600 | $51,100 | $378,500 |
Source: Public Records
Map
Nearby Homes
- 93 Maple St
- 10 Tulip Ln
- 109 Montague City Rd
- 2 Orchard St
- 38 Randall Wood Dr
- 43 Crescent St
- 30 Grinnell St
- 89 Montague St
- 0 Marshall St
- 114 Montague St
- 335 Federal St
- 55 A + B Randall Rd
- 75 School St
- 73 Washington St
- 111-113 Deerfield St
- 227 Deerfield St
- 0 Millers Falls Rd Unit 73034825
- 35 Shattuck St Unit 37
- 35-37 Shattuck St
- 45 Millers Falls Rd
- 302 Montague City Rd
- 304 Montague City Rd
- 14 Depot St
- 36 Depot Rd
- 10 Depot St
- 38 Depot St
- 306 Montague City Rd
- 288 Montague City Rd Unit 290
- 4 Depot St
- 4 Depot St
- 286 Montague City Rd
- 308 Montague City Rd
- 284 Montague City Rd
- 15 Depot St
- 11 Depot St
- 9 Depot St
- 312 Montague City Rd
- 2 Solar Ave
- 288-29 Montague City Rd
- 282 Montague City Rd