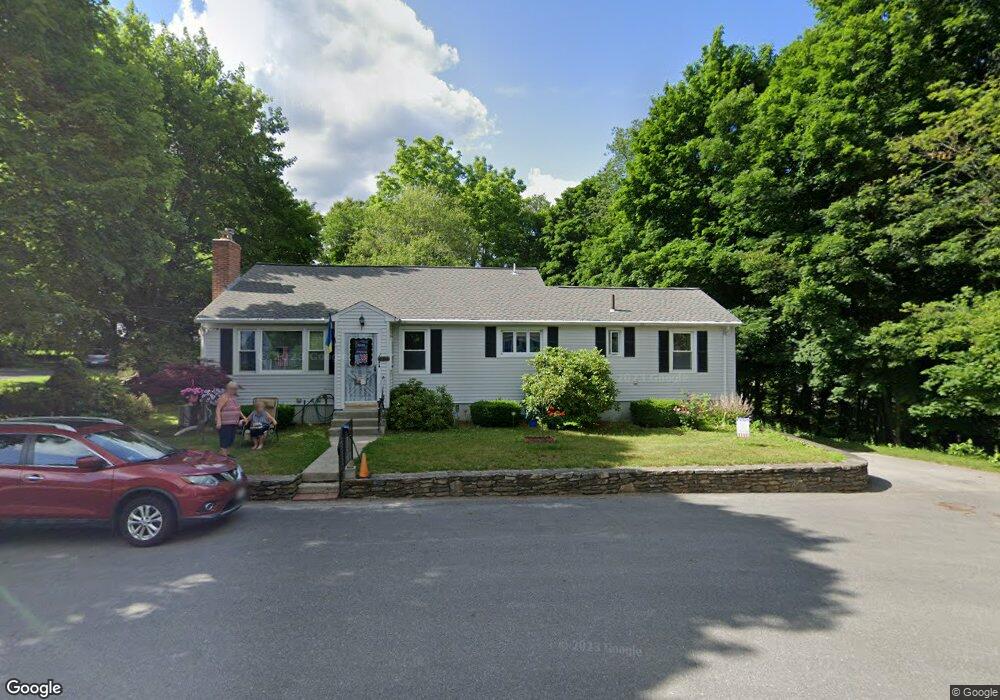
7 Buron Terrace Auburn, MA 01501
Stoneville NeighborhoodEstimated Value: $495,000 - $519,176
4
Beds
4
Baths
1,521
Sq Ft
$336/Sq Ft
Est. Value
About This Home
This home is located at 7 Buron Terrace, Auburn, MA 01501 and is currently estimated at $511,294, approximately $336 per square foot. 7 Buron Terrace is a home located in Worcester County with nearby schools including Auburn Senior High School and Shrewsbury Montessori School - Auburn Campus.
Ownership History
Date
Name
Owned For
Owner Type
Purchase Details
Closed on
Jul 28, 2025
Sold by
Ducharme Daniel A
Bought by
Ducharme Daniel A and Fohlin Darlene G
Current Estimated Value
Purchase Details
Closed on
Jul 23, 2014
Sold by
Guittar Lynne M
Bought by
Guittar Lynne M and Ducharme Daniel A
Purchase Details
Closed on
Aug 30, 2013
Sold by
Des Ft and Guittar
Bought by
Guittar Lynne M
Purchase Details
Closed on
Nov 27, 1963
Bought by
Guittar Lynne M
Create a Home Valuation Report for This Property
The Home Valuation Report is an in-depth analysis detailing your home's value as well as a comparison with similar homes in the area
Home Values in the Area
Average Home Value in this Area
Purchase History
| Date | Buyer | Sale Price | Title Company |
|---|---|---|---|
| Ducharme Daniel A | -- | -- | |
| Ducharme Daniel A | -- | -- | |
| Guittar Lynne M | -- | -- | |
| Guittar Lynne M | -- | -- | |
| Guittar Lynne M | -- | -- | |
| Guittar Lynne M | -- | -- | |
| Guittar Lynne M | -- | -- |
Source: Public Records
Tax History Compared to Growth
Tax History
| Year | Tax Paid | Tax Assessment Tax Assessment Total Assessment is a certain percentage of the fair market value that is determined by local assessors to be the total taxable value of land and additions on the property. | Land | Improvement |
|---|---|---|---|---|
| 2025 | $6,505 | $455,200 | $114,600 | $340,600 |
| 2024 | $6,377 | $427,100 | $109,100 | $318,000 |
| 2023 | $6,136 | $386,400 | $99,100 | $287,300 |
| 2022 | $5,672 | $337,200 | $99,100 | $238,100 |
| 2021 | $1,154 | $304,900 | $87,500 | $217,400 |
| 2020 | $5,482 | $304,900 | $87,500 | $217,400 |
| 2019 | $5,283 | $286,800 | $86,600 | $200,200 |
| 2018 | $1,160 | $278,100 | $81,000 | $197,100 |
| 2017 | $4,961 | $270,500 | $73,400 | $197,100 |
| 2016 | $4,032 | $222,900 | $77,000 | $145,900 |
| 2015 | $3,880 | $224,800 | $77,000 | $147,800 |
| 2014 | $3,353 | $193,900 | $73,400 | $120,500 |
Source: Public Records
Map
Nearby Homes